Building a Cloud SIEM with AWS OpenSearch Security Analytics
In this blog post, I’ll show you how to build a lightweight SIEM system in AWS using AWS OpenSearch and its Security Analytics features, combined with Zeek. This solution enables real-time monitoring of cloud network traffic and generates alerts when potential threats are detected.
Introduction
When setting up a cloud infrastructure, security should always be the top priority. By prioritizing a strong security posture, organizations can ensure that their assets and workloads are protected from attacks and exploits. In a dynamic cloud environment where customers can scale their operations to unprecedented levels, having powerful, robust, centralized threat detection, analysis, and alerting capabilities becomes essential. One effective solution to meet these needs is a centralized cloud SIEM (Security Information and Event Management) system. SIEM enhances an organization’s ability to detect, analyze, and respond to cybersecurity threats in real time, while providing centralized visibility into consolidated logs and data from across the cloud. By automatically correlating and analyzing security data from different sources, SIEM systems enable faster and more efficient responses to potential security incidents.
A versatile AWS service that can function as a SIEM is AWS OpenSearch, especially when combined with OpenSearch Security Analytics. Security Analytics is a SIEM solution designed for OpenSearch, providing out-of-the-box tools for investigating, detecting, analyzing, and responding to security threats. It offers features for defining detection rules, generating alerts, and responding effectively to security incidents.
In addition to application and AWS service logs, network logs play a crucial role in ensuring comprehensive cloud network traffic analysis. These network logs should be collected and analyzed centrally across the entire AWS environment before being forwarded to the SIEM system. A widely adopted tool for capturing and analyzing network traffic logs is Zeek, an open-source, passive network traffic analyzer. Zeek provides a rich set of logs that describe network activity and serves as a powerful network security monitor (NSM).
In this blog post, I’ll demonstrate how you can leverage OpenSearch Security Analytics alongside Zeek and AWS Traffic Mirroring to build a centralized cloud SIEM solution, allowing you to monitor cloud network traffic and effectively detect and respond to security threats.
Architecture
To start, let’s explore the architecture we’ll deploy in this example. The diagram below provides a high-level overview of the setup we aim to simulate. Our goal is to create a cloud-based SIEM solution in AWS, utilizing AWS OpenSearch Security Analytics, Zeek, and AWS Gateway Load Balancer.
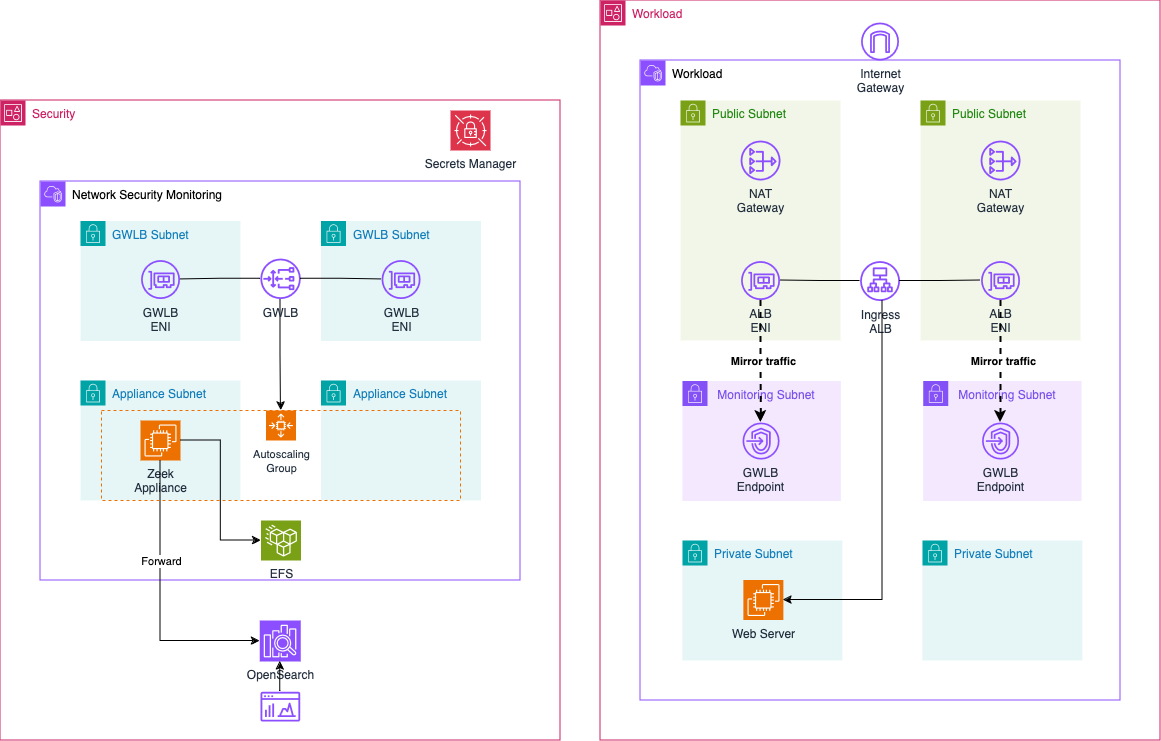
The architecture spans two AWS accounts: the Workload Account and the Security Account. The Security Account hosts the Network Security Monitoring VPC, where the Zeek appliance operates behind an AWS Gateway Load Balancer. The Gateway Load Balancer allows a centralized, highly available, and scalable operation of the network analysis appliance, distributing traffic efficiently. We’ll use Gateway Load Balancer Endpoints to forward network traffic from multiple accounts to this central location via the GENEVE protocol, ensuring that the traffic reaches the Zeek appliance intact and unaltered. This design allows for a lightweight Zeek integration in each monitored account.
The Zeek appliance is deployed within an AWS Auto Scaling Group, ensuring resilience by recovering automatically in case of instance failure or availability zone outages. In a clustered setup, the Auto Scaling Group could potentially dynamically scale Zeek workers based on the volume of network traffic requiring analysis. The logs analyzed by Zeek are forwarded to an AWS OpenSearch cluster in the same account, and logs are also stored persistently on a highly available Amazon EFS (Elastic File System). This ensures that logs remain available even if an instance terminates unexpectedly, and it also enables replaying logs to OpenSearch if needed. Security administrators can use OpenSearch Dashboards to analyze ingested log files, while OpenSearch Security Analytics provides advanced threat detection and alerting capabilities.
In the Workload Account, we have the Workload VPC, which hosts a sample web server behind an internet-facing Application Load Balancer (ALB). This VPC is divided into three subnet types: GLWB, Public, and Private. The GLWB subnets contain the Gateway Load Balancer Endpoints, which are connected to the Gateway Load Balancer in the Security VPC. Users can access the web server via the Application Load Balancer. To analyze the traffic reaching the ALB, AWS Traffic Mirroring is used. We’ll mirror traffic from the ALB’s Elastic Network Interfaces (ENIs) and forward it to the Gateway Load Balancer Endpoints in the Workload VPC. This mirrored traffic is then sent to the Zeek appliance via the Gateway Load Balancer.
This setup enables centralized network analysis within AWS, running in parallel to the deployed workloads without interfering with their operation.
Traffic Flow
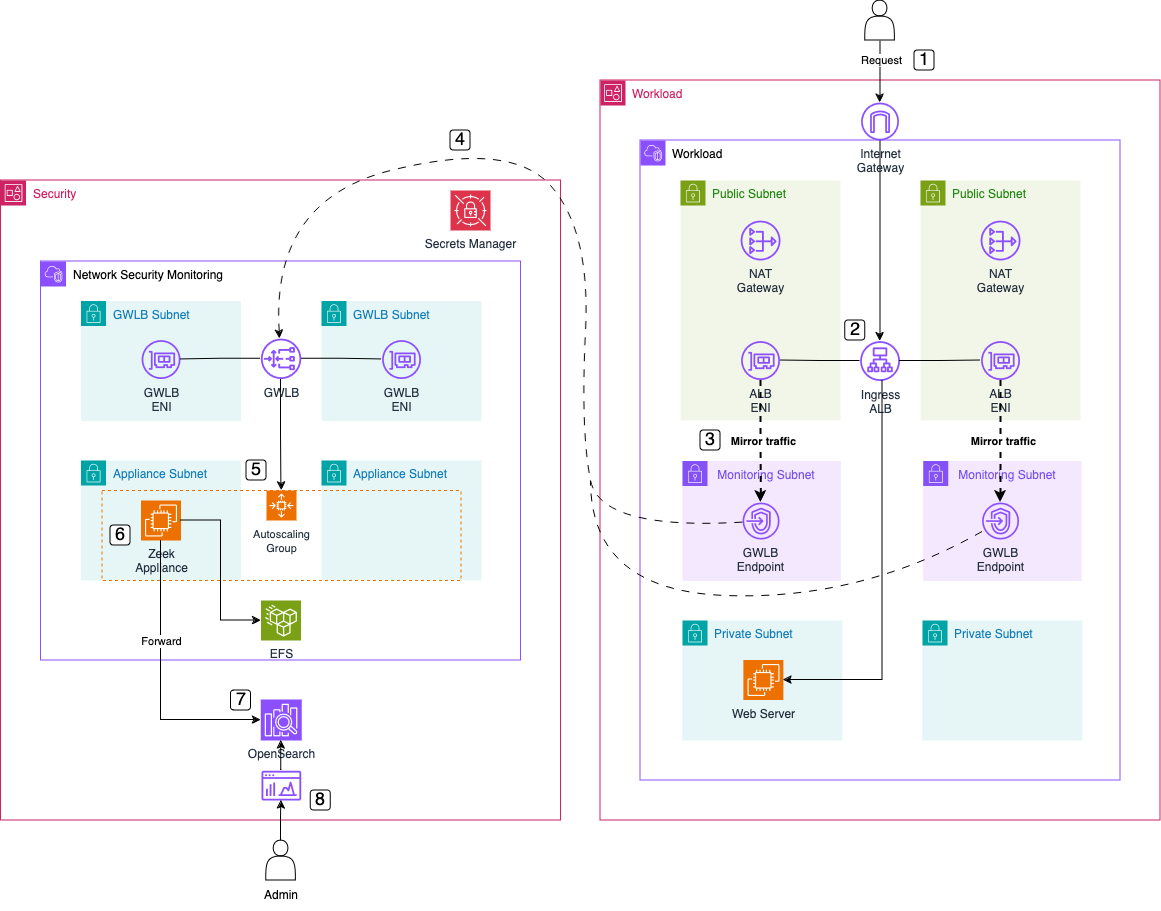
Now, let’s dive into the ingress traffic flow when using our Zeek setup with a Gateway Load Balancer.
-
User Request: The user sends a request to the DNS name of the Application Load Balancer (ALB) to access the web server.
-
Request Handling: The ALB forwards the request to the web server, which processes it and sends a response back to the user.
-
Traffic Mirroring: AWS Traffic Mirroring mirrors the traffic flowing through the ALB’s Elastic Network Interface (ENI). The mirrored traffic is sent to the Gateway Load Balancer Endpoint (GWLB Endpoint) in the Workload VPC.
-
Forward to GWLB: The GWLB Endpoint receives the mirrored traffic, encapsulates it using the GENEVE protocol, and forwards it to the Gateway Load Balancer (GWLB) in the Inspection VPC.
-
Send to Zeek: The GWLB forwards the encapsulated traffic to the Zeek appliance, which is part of the target group behind the Gateway Load Balancer.
-
Traffic Analysis: The Zeek appliance removes the GENEVE encapsulation, analyzes the network traffic, and generates log files ready for ingestion into OpenSearch.
-
Log Forwarding: The Zeek appliance forwards the analyzed logs to the AWS OpenSearch Cluster using Logstash for centralized storage and indexing.
-
Log Analysis: Once the logs are ingested, security experts can use the OpenSearch Dashboard for network traffic analysis and OpenSearch Security Analytics for threat detection and alerting.
Zeek Appliance Workflow
Before deploying the solution, let’s briefly review the workflow of the appliance and the tools used for analyzing, parsing, and forwarding the log files.
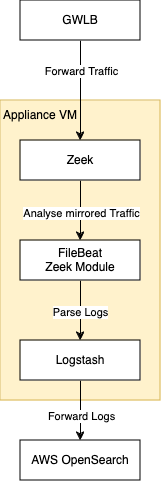
Mirrored traffic from the Workload Account arrives at the Zeek appliance, encapsulated in the GENEVE protocol through the Gateway Load Balancer on port 6081. Zeek attempts to decapsulate traffic using this UDP destination port. Once decapsulated, Zeek analyzes the network traffic and generates a set of log files.
These log files are then parsed by Filebeat, using the Zeek module for structured parsing. Filebeat is a lightweight shipper that forwards and centralizes log data. Installed on your servers, Filebeat monitors specified log files or locations, collects log events, and forwards them to either Elasticsearch or Logstash for indexing. The Zeek module specifically handles the parsing of Zeek log files.
After parsing, the logs are collected by Logstash and then forwarded to the AWS OpenSearch cluster for further analysis.
Filebeat with the Zeek module facilitates straightforward log parsing and forwarding. However, OpenSearch versions 1.x to 2.x do not support direct ingestion via Filebeat. Therefore, logs will be forwarded to Logstash first, which will handle the ingestion into the AWS OpenSearch cluster.
Bootstrap Environment
Security Account
The code associated with this blog post is hosted on GitHub. Feel free to clone the repository or manually copy the code to your local machine. Within the provided directory, you’ll find two folders: inspection and workload. The inspection folder contains the complete Terraform configuration for the Zeek setup in the Network Security Monitoring VPC, while the workload folder contains the setup for the web server.
Before deploying our configuration, you need to adjust a Terraform variable. Navigate to the inspection folder and open the terraform.tfvars file. You’ll find the following variable at the bottom:
allowed_service_principal_arns = ["arn:aws:iam::xxxxxxxxxx:root"]
This variable defines which accounts are allowed to access the Gateway Load Balancer via Gateway Load Balancer Endpoints and AWS PrivateLink. This variable also defines which AWS accounts are allowed to access the AWS Secrets Manager secret that stores the Gateway Load Balancer Endpoint information. Enter your AWS Account ID for the Workload to enable the connection between the two accounts and VPCs via the VPC Endpoints.
After making these adjustments, navigate to the inspection folder and run terraform init to initialize the Terraform providers, followed by terraform apply to deploy the Zeek infrastructure.
Deploying AWS OpenSearch can take up to 20 minutes.
Workload Account
Once the resources in the Security account are deployed, the next step is to set up the workload resources.
Before proceeding with the deployment, you’ll need to modify a Terraform variable. Navigate to the workload folder and open the terraform.tfvars file. At the bottom, you’ll find the following variable:
secretsmanager_secret_arn = "arn:aws:secretsmanager:xxxxxxxxxx"
This variable specifies the ARN of the AWS Secrets Manager secret that contains the Gateway Load Balancer Endpoint connection details. It is used to establish the connection between the workload VPC and the Zeek appliance in the Security account. Replace the placeholder with the actual ARN of the secret, which can be retrieved from the gwlb_secretsmanager_secret_arn output of the inspection Terraform configuration.
After making these adjustments, navigate to the workload folder and run terraform init to initialize the Terraform providers, followed by terraform apply to deploy the workload infrastructure.
Setup AWS OpenSearch Security Analytics
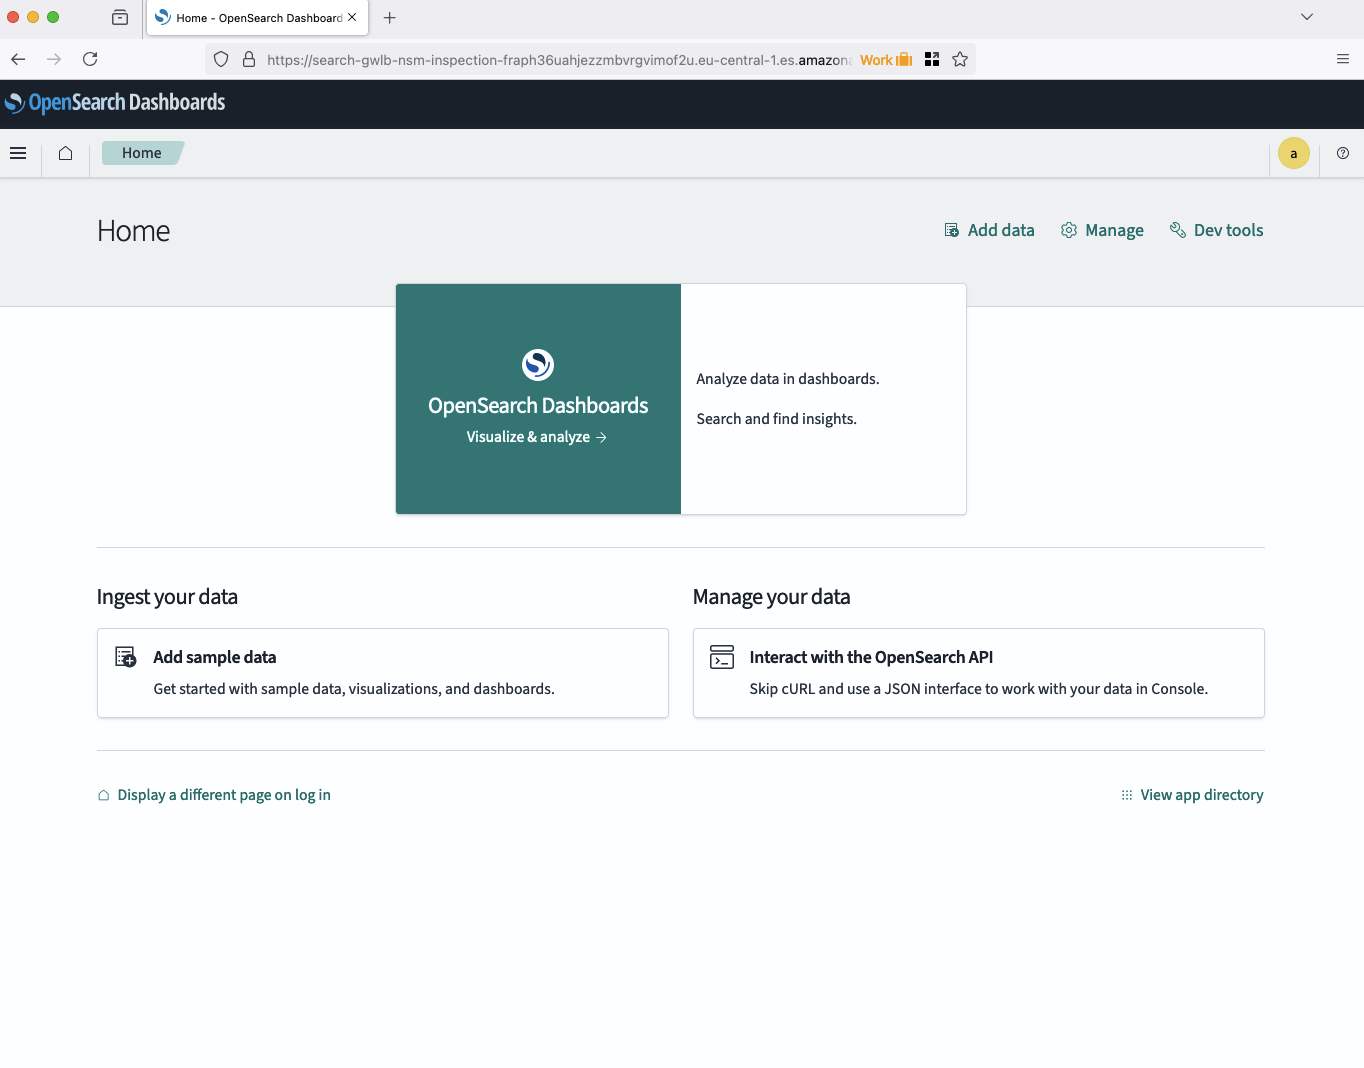
After having deployed the infrastructre in both the security and workload account, we will continue by configuring the OpenSearch cluster. Open the OpenSearch Dashboard and login using the credentials that were created by Terraform. You can retrieve the endpoint of the Dashboard using the Terraform output opensearch_dashboard_endpoint and the login data from the AWS Secrets Manager secret mentioned in opensearch_secretsmanager_secret_name. Once logged in, you should be greated by the welcome screen.
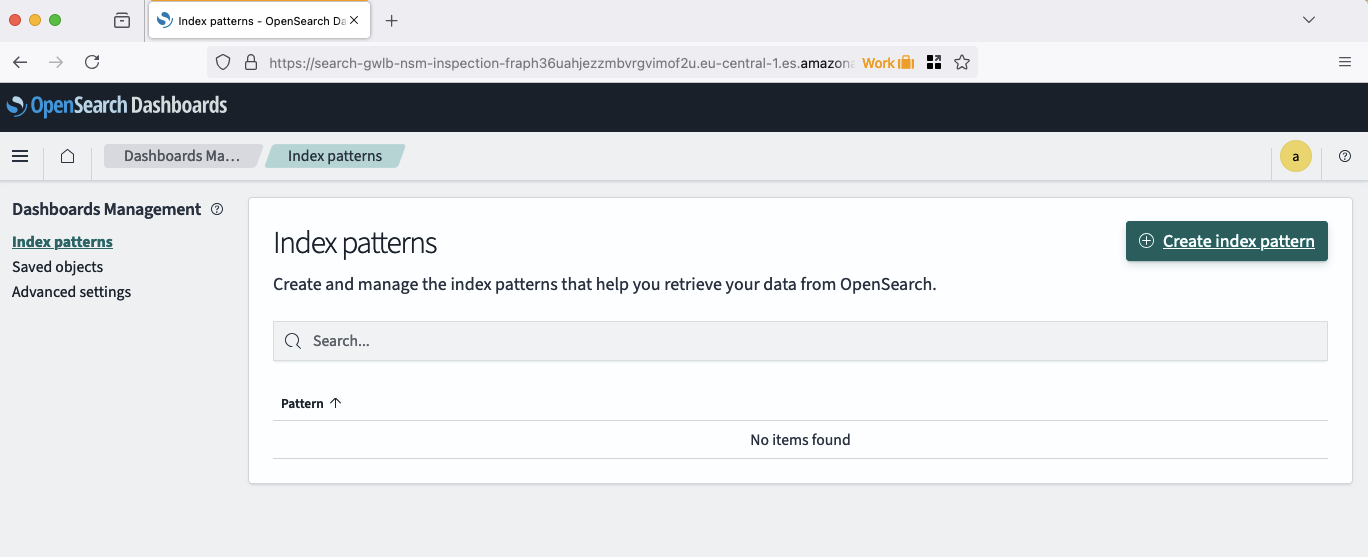
Before we can start analysing the Zeek logs, we will have to create an index pattern in OpenSearch. Open the menu by clicking on the burger menu in the top left corner. Navigate to Dashbarods Management and select Index patterns. Select Create index pattern to create a new pattern.
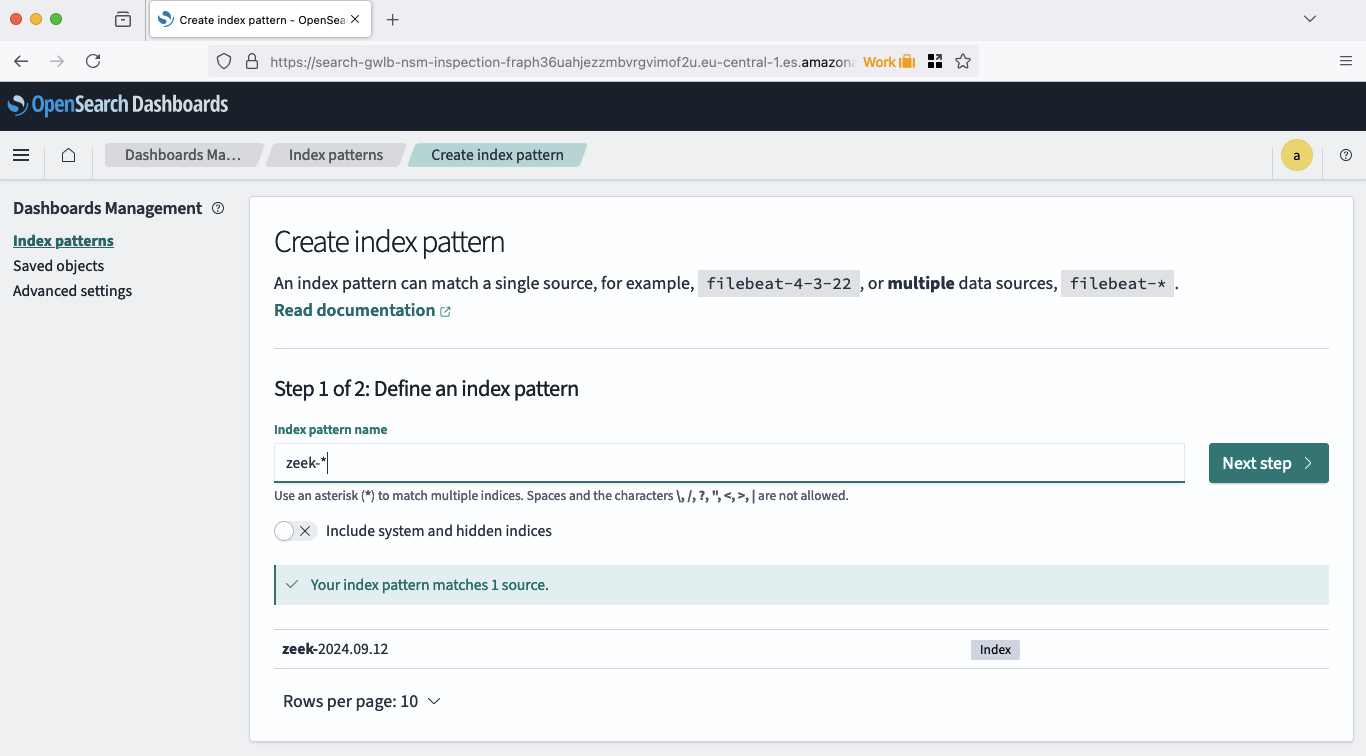
Logstash creates indecies using the pattern zeek-%{+YYYY.MM.dd}. Therefore, we have to define the pattern zeek-* in order to include all Zeek logs in the future and from the past. Type in zeek-* under Index pattern name and click Next step.
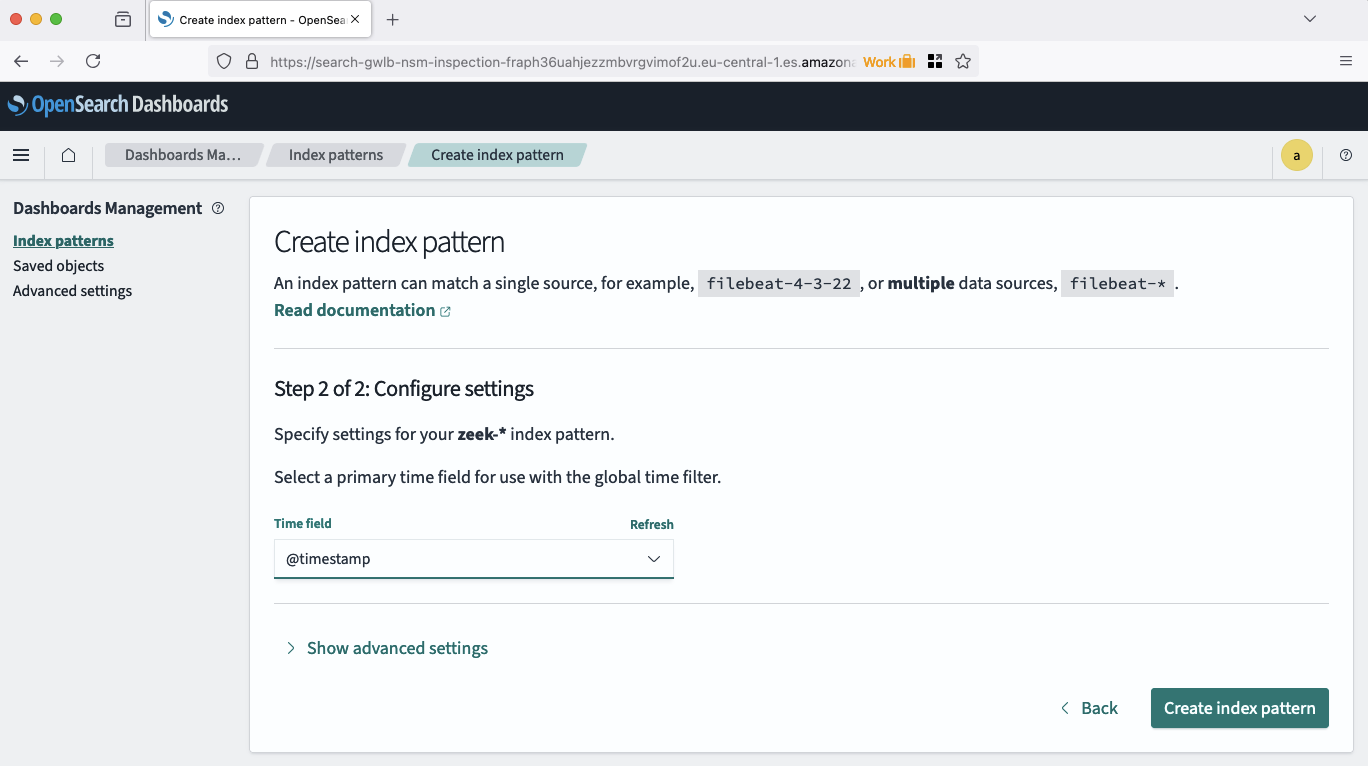
The last step to finish defining our index pattern consists of choosing our primary timefield. Choose @timestamp and click Create index pattern. Congratulations, the index pattern has been created.
Once the index pattern has been defined, we are able to analyse our logs using OpenSearch. Naviagte to the discovery tab by opening the burger menu in the top left corner and selecting the option Discover under OpenSearch Dashboards. A new page should open, showcasting all the Zeek logs that already have been ingested into OpenSearch.
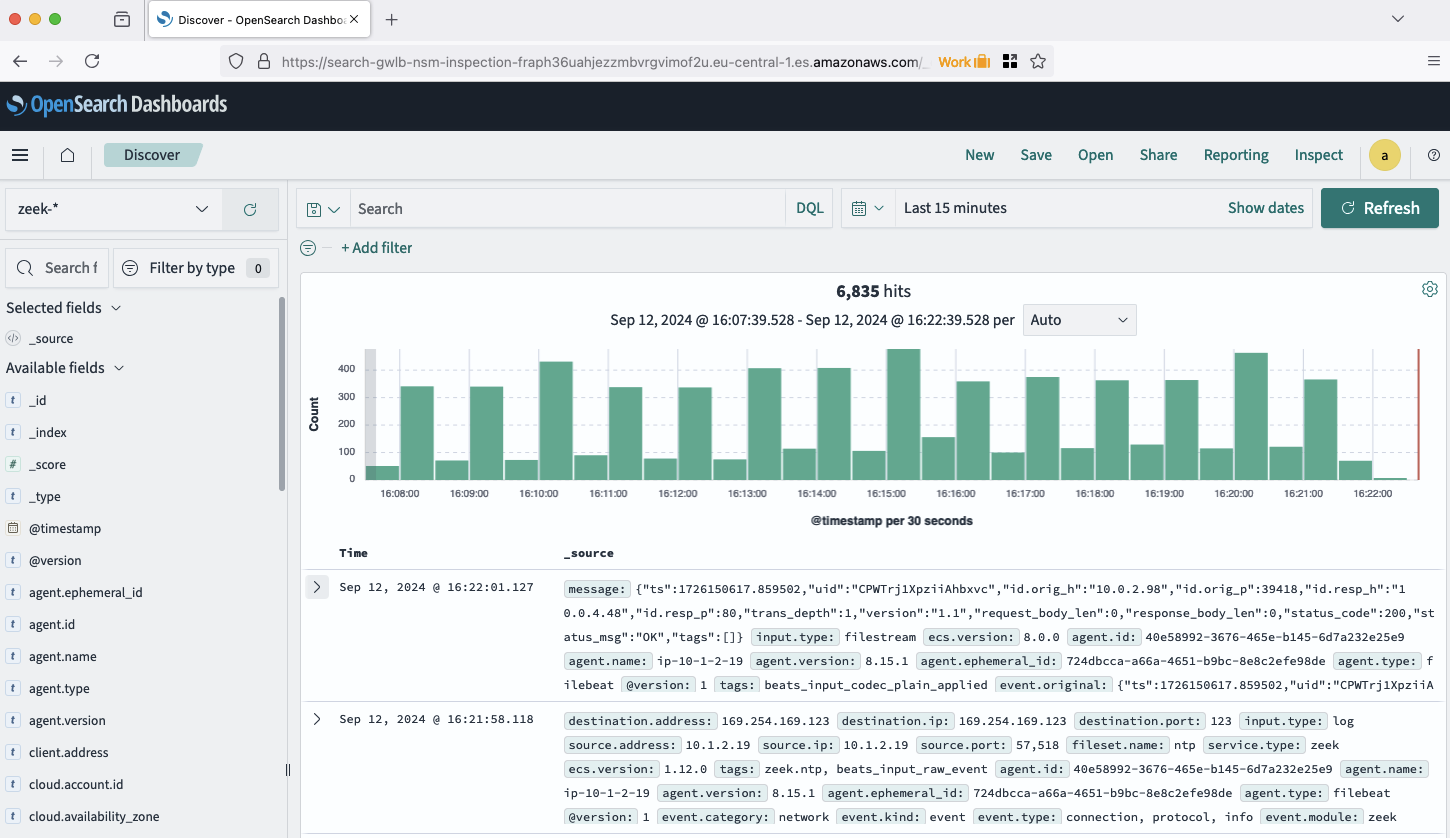
Feel free to explore the logs and the Discover dashboard to get familiar with the OpenSearch capabilities. Expand some of the logs and look at the detailed information present in each of them. Send a request to the AWS Application Load Balancer and try to find your request by looking up your public IP addresse in OpenSearch.
Next, we will set up OpenSearch Security Analytics to gain insights from Zeek logs and enable automated threat detection and alerting. Start by opening the burger menu in the top left corner of the OpenSearch Dashboard and selecting Security Analytics under OpenSearch Plugins. This will open the Security Analytics Overview page.
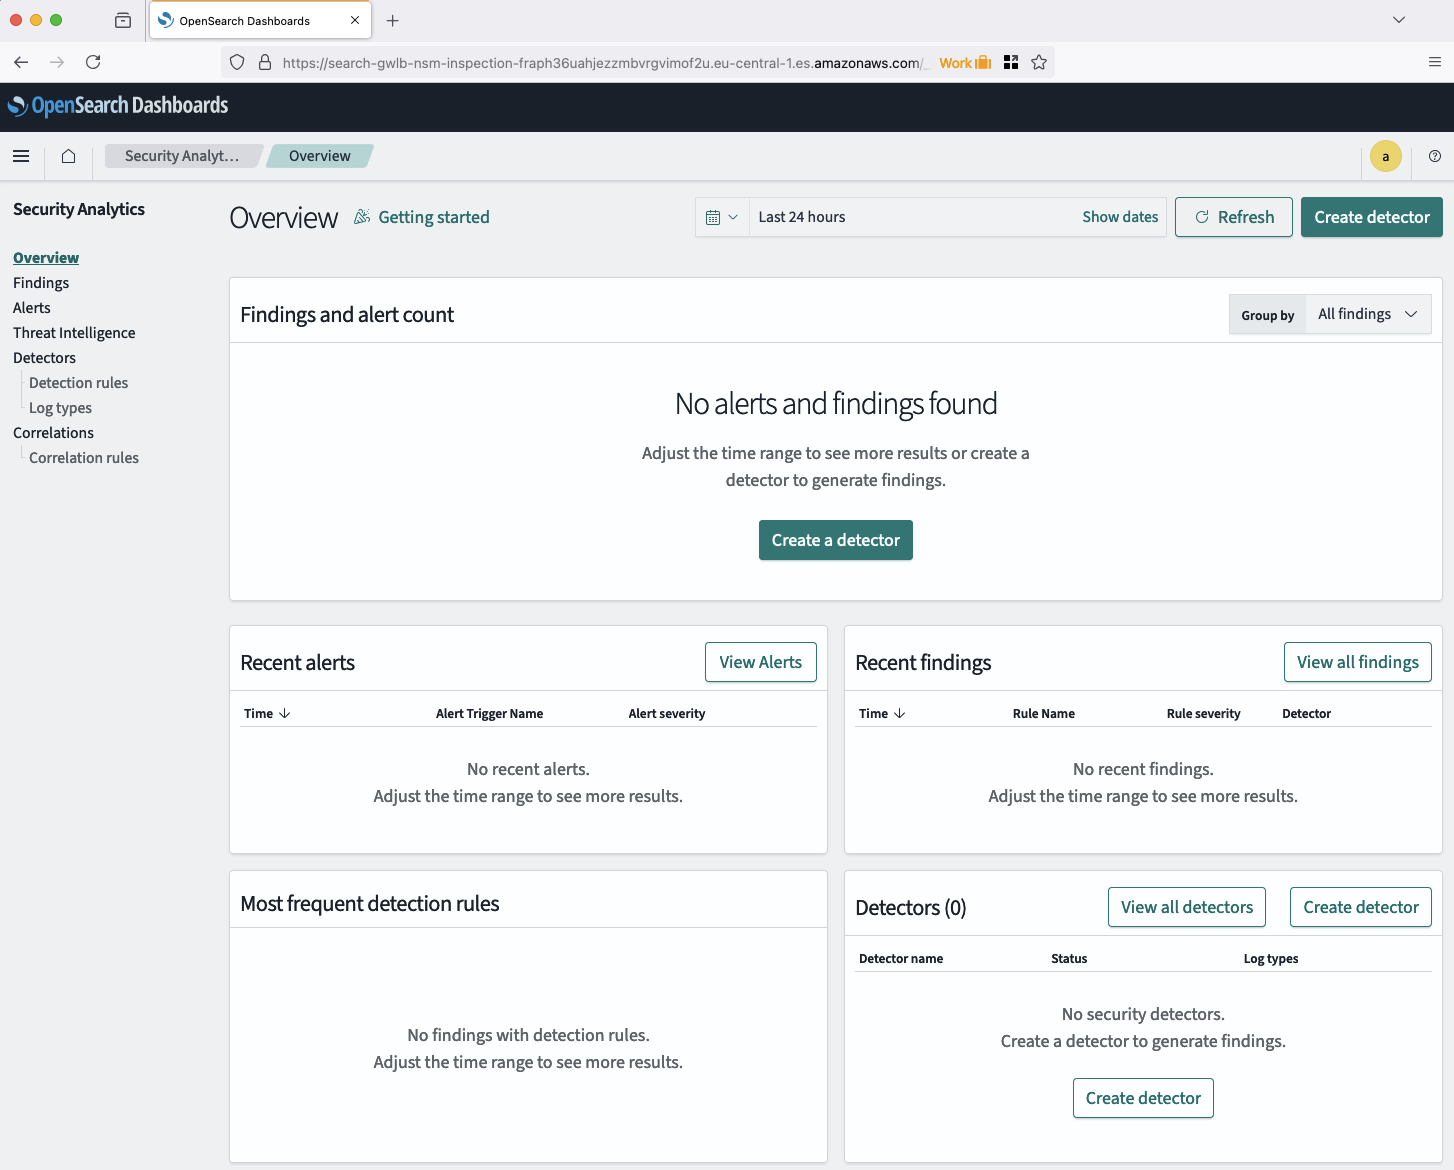
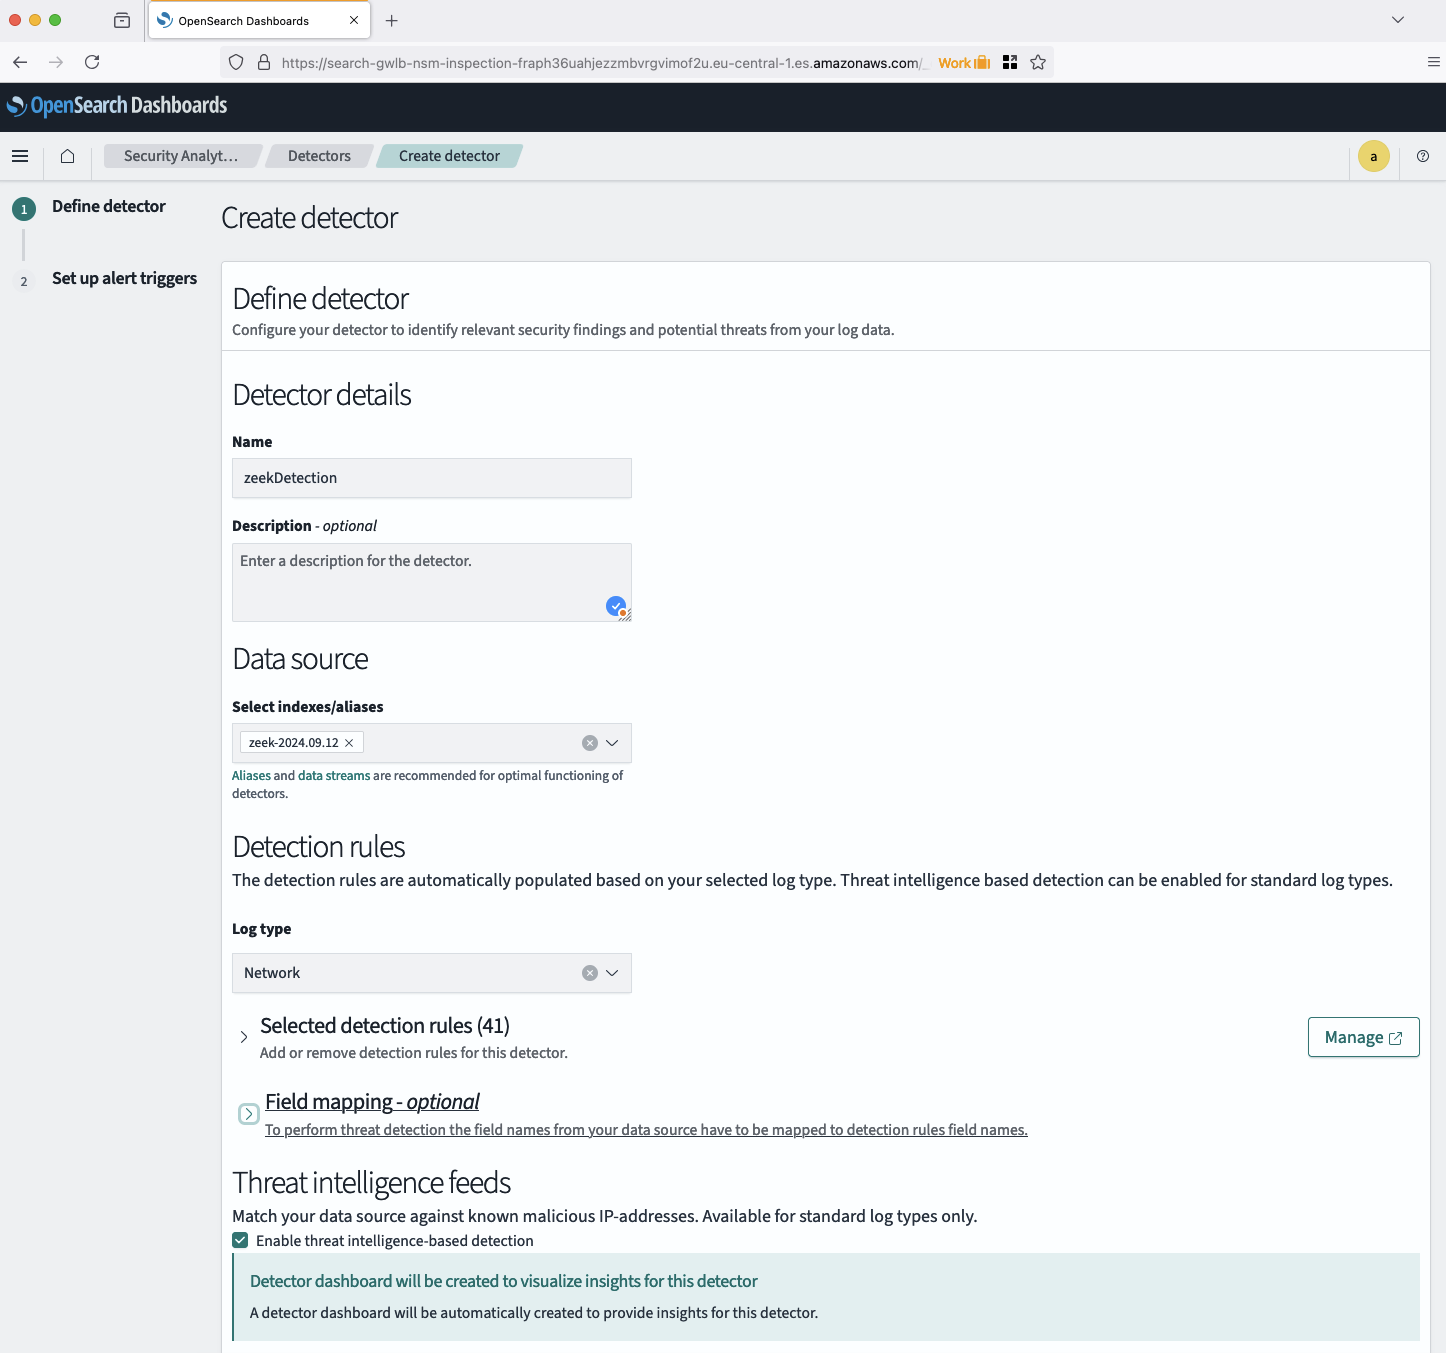
To generate findings and alerts, we first need to create a detector for the logs. Click on Create a detector to begin. A new window will appear where you can define the detector’s details, such as the index source and log type. Select the recently created Zeek index as the source, and choose Network as the log type under Detection rules. Most field mappings should be automatically handled by OpenSearch Security Analytics. Ignore any fields that cannot be mapped for now. You can also review the detection rules chosen by Security Analytics. Once ready, create the detector.
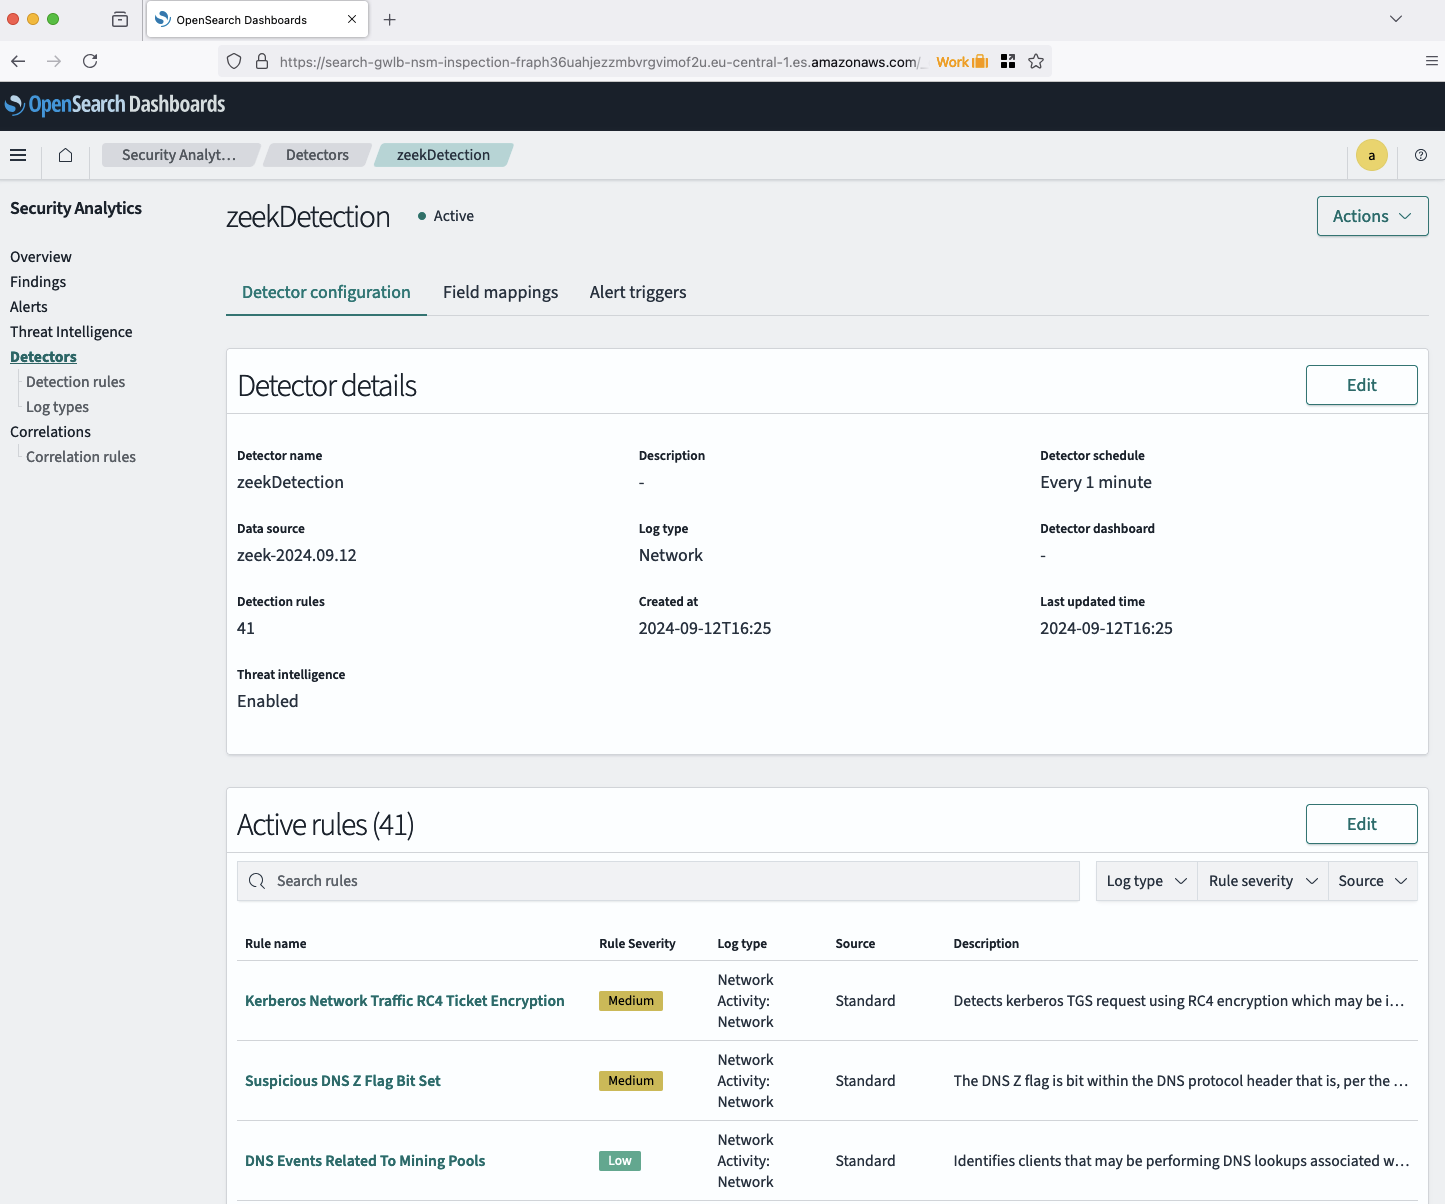
After the detector is created, you’ll be taken to the detector details page where you can review the detector settings and active rules in more detail. You can also set up alerts and review the active rule set for your new detector.
The detector will now scan your log files and evaluate their content based on the predefined rules. Findings will be generated when matches are found. To review them, navigate to the Findings section in the left-hand menu. A new window will display the generated findings. Take time to explore the different findings and their details.
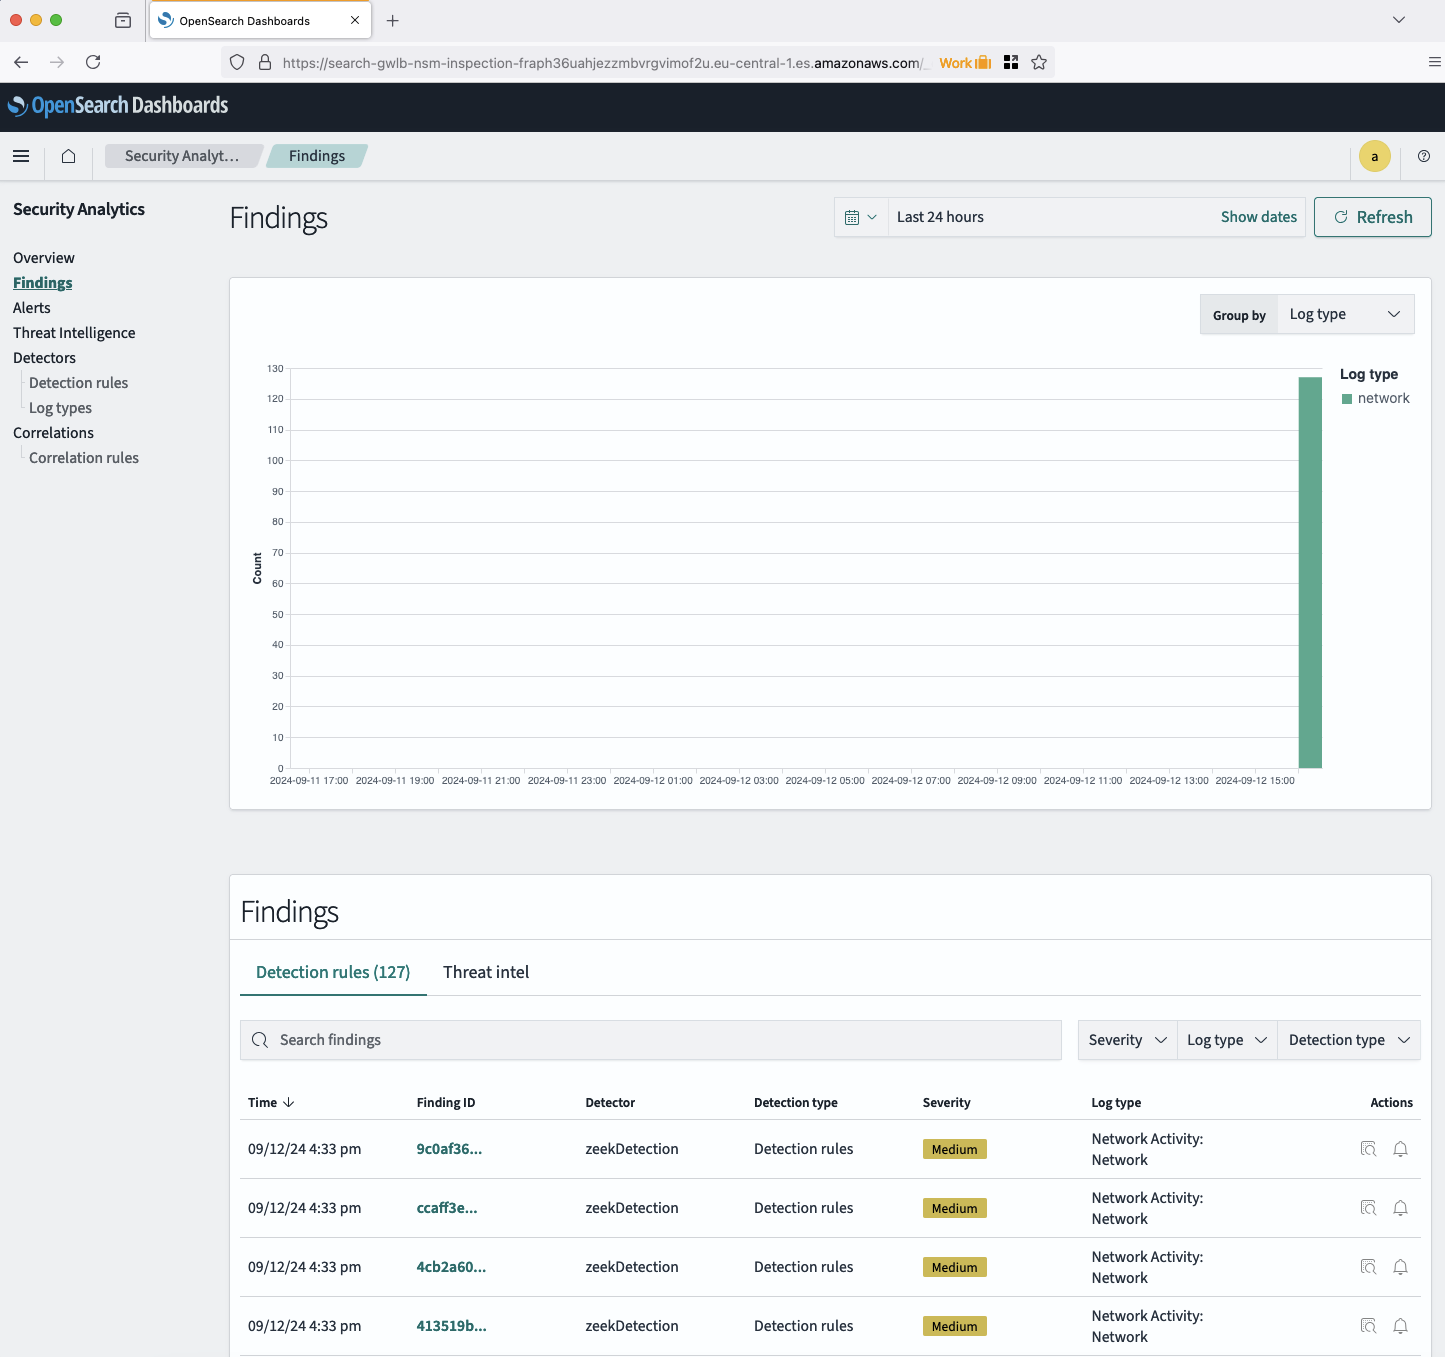
It may take a few minutes for the first findings to be generated. Refresh the page after a few minutes to view the initial findings.
Congratulations! You create a threat detection and alerting solution using AWS OpenSearch, AWS Gateway Load Balancer and Zeek.
Summary
The architecture we’ve implemented serves as a foundational example, open to optimization for enhanced robustness and efficiency. Here are a few potential enhancements:
-
Zeek Cluster: In our current example, we are using a single Zeek instance. For larger or more demanding environments, Zeek can be deployed as a cluster to improve performance and fault tolerance. You can refer to the official Zeek Cluster Setup documentation for guidance on this configuration.
-
Ingest more Logs: Currently, we only ingest network logs generated by Zeek. To gain a more comprehensive view of your environment, consider combining logs from multiple sources such as AWS Web Application Firewall (WAF) logs, VPC Flow Logs, and Load Balancer Logs. By creating OpenSearch detectors for these additional log types, you can correlate events across different layers of the infrastructure, leading to more accurate and nuanced threat detection.
-
More refined Detector Configuration: While we are using predefined detection rules, creating custom rules tailored to your specific environment and use cases can enhance security monitoring. Additionally, configuring alerts for critical findings ensures that security teams are promptly notified of potential threats. A more refined and customized setup allows you to maximize the capabilities of OpenSearch Security Analytics.
-
Define Log Lifecycle: As logs accumulate, data volumes can grow rapidly. It’s important to implement a log lifecycle strategy to offload and archive older log files. This keeps the OpenSearch cluster and indices smaller, improving query performance. Older logs can be archived for auditing purposes, ensuring that critical data is retained without slowing down your operational environment.
I hope you enjoyed this example and learned something new. I look forward to your feedback and questions. For the complete example code, please visit my Github.
— Hendrik
Title Photo by Tim Mossholder on Unsplash