Creating Recommended Alarms for Amazon OpenSearch Service with Terraform
Amazon OpenSearch Service is a powerful tool for search, log analytics, and RAG (Retrieval-Augmented Generation) systems. To ensure optimal performance and reliability, effective monitoring is crucial.
This article explores how to leverage CloudWatch metrics and alarms to monitor Amazon OpenSearch Service, enabling proactive identification and resolution of potential issues before they impact your users.
Prerequisites
Before diving into the monitoring setup, ensure you have:
- Basic knowledge of AWS, Terraform and Amazon OpenSearch Service
- An active AWS account with console access and needed permissions to create CloudWatch resources and read the configurations.
- A running Amazon OpenSearch Service cluster
- The following tools installed:
- Terraform (local machine or CI/CD pipeline)
- AWS CLI (configured with your AWS credentials)
Understanding CloudWatch Metrics and Alarms for Amazon OpenSearch Service
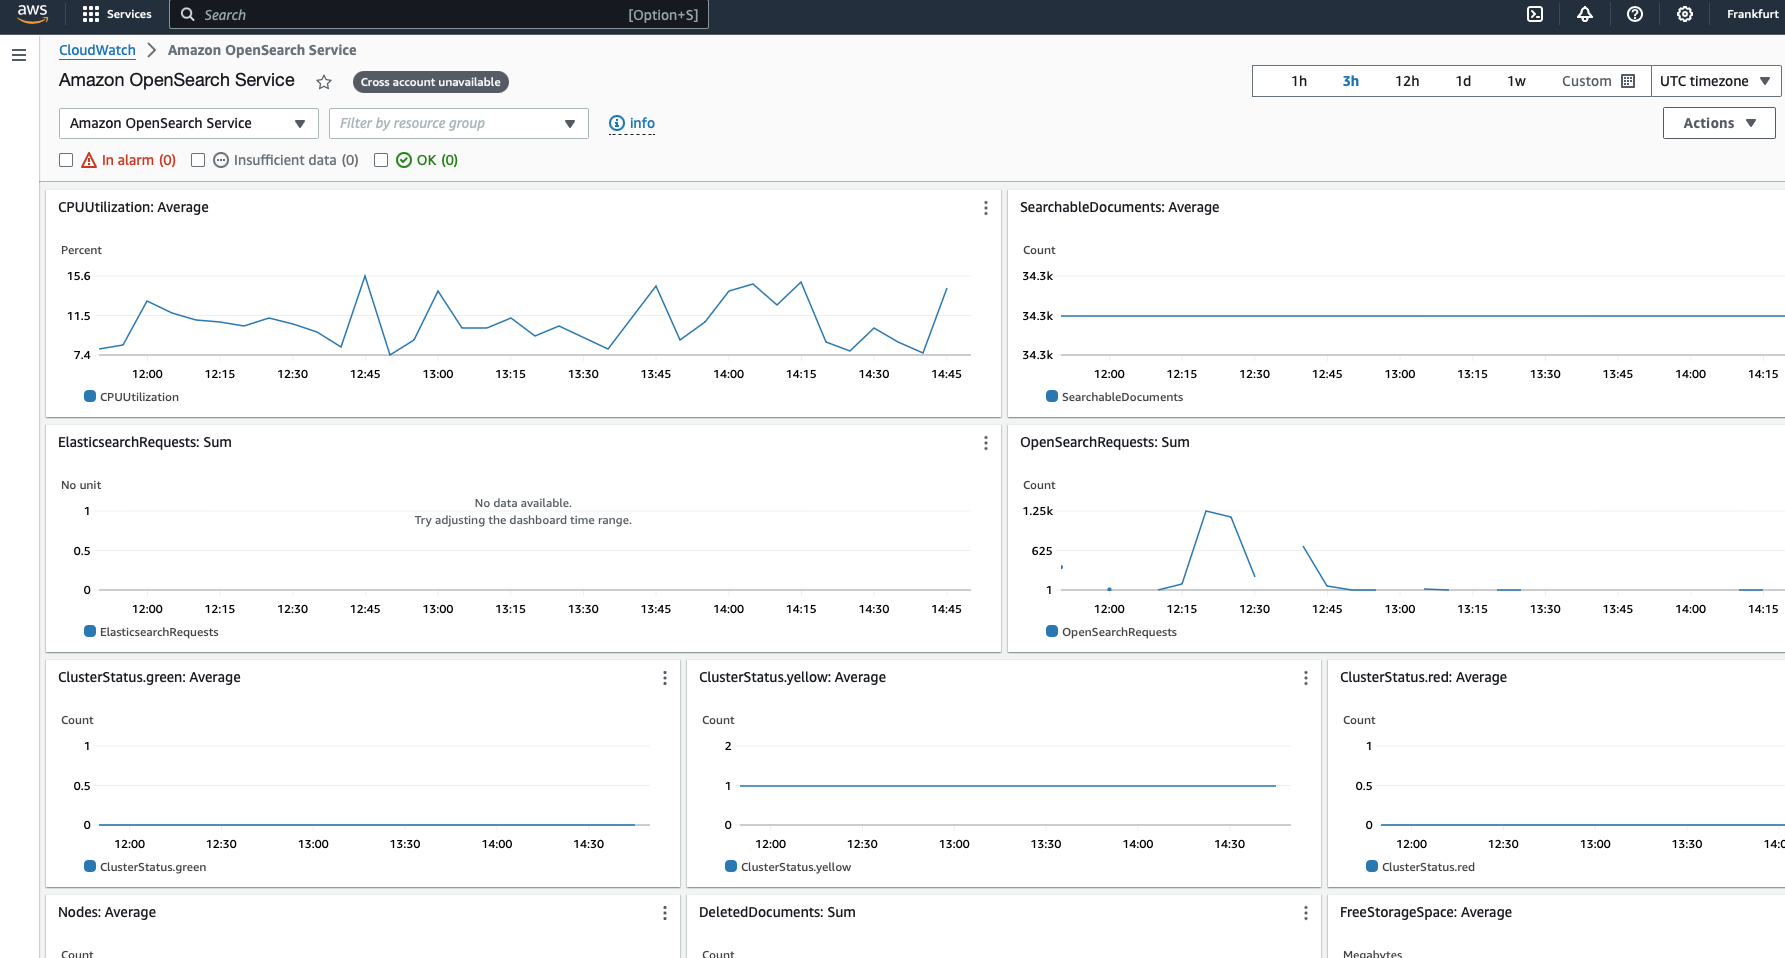
Amazon OpenSearch Service generates a variety of metrics that provide insights into cluster performance, current load, and overall health. These metrics are accessible through the AWS Console:
- Navigate to CloudWatch -> Metrics -> All Metrics -> ES/OpenSearch Metrics
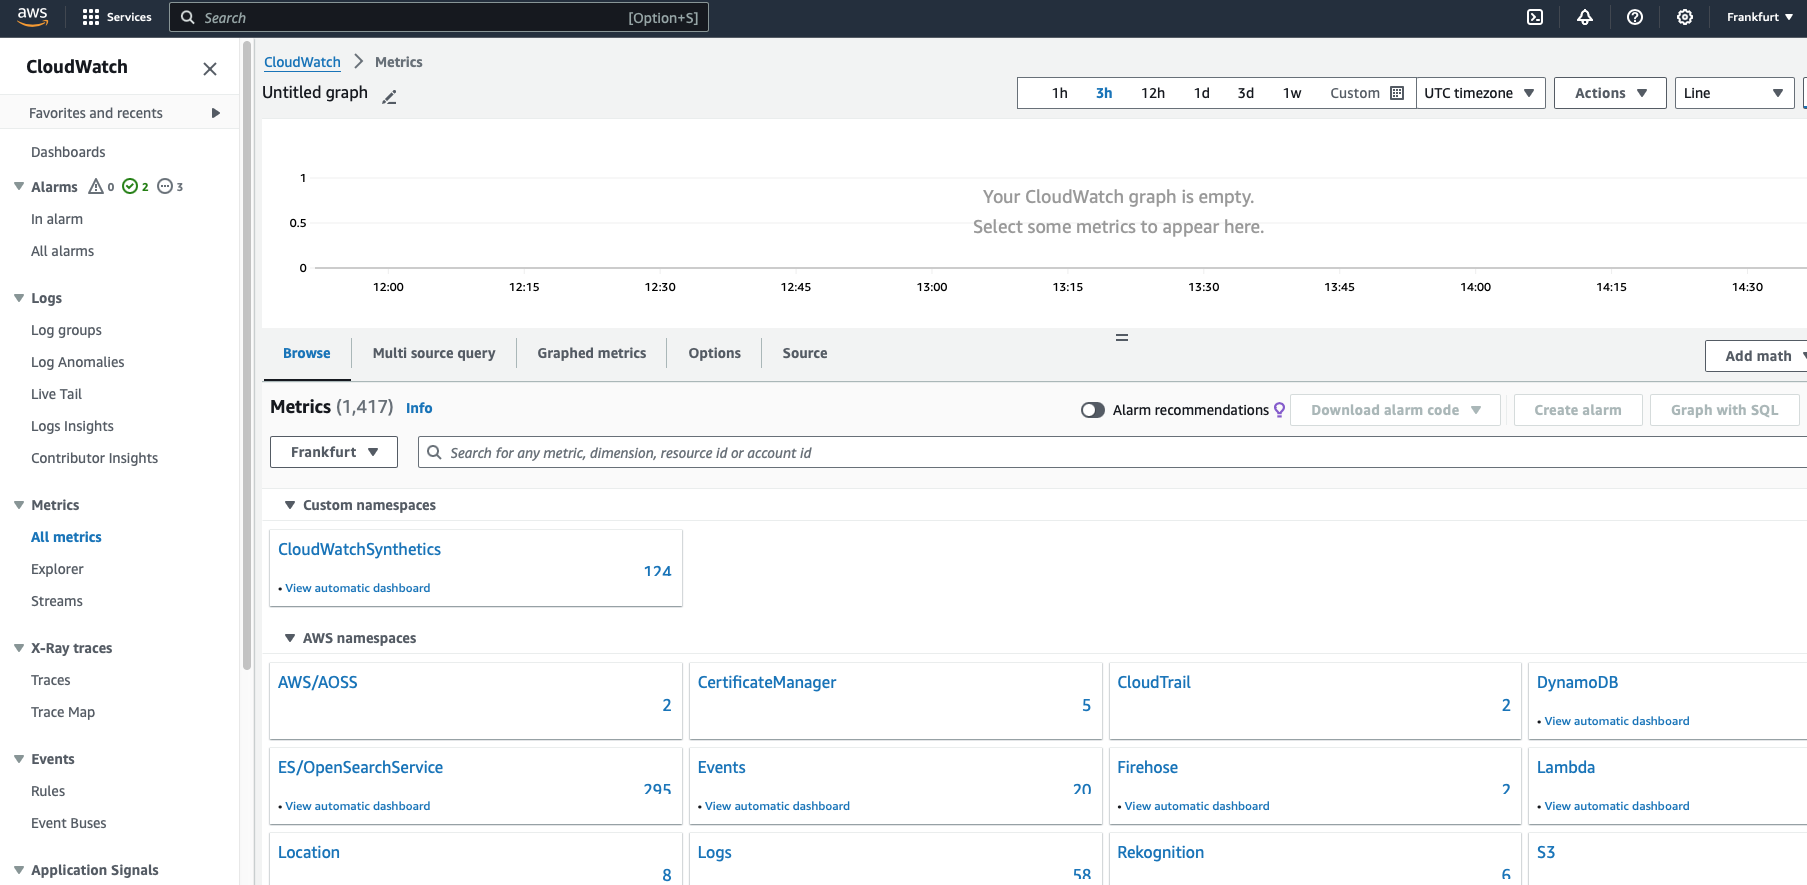
- Use the automated dashboard to track metric evolution over time
Monitoring these metrics helps you understand the current state of your OpenSearch clusters. However, to proactively manage your clusters, it’s crucial to set up CloudWatch alarms. These alarms trigger actions when specific metrics exceed defined thresholds for a certain period, enabling you to respond promptly to potential issues.
For example, you can configure AWS to send you an email if your cluster health status remains red for more than one minute. The following section provides recommended alarms for Amazon OpenSearch Service and guidance on how to respond to them.
Recommended CloudWatch Alarms for Amazon OpenSearch Service:
-
Node Failures: Identify when a node goes down, affecting cluster performance and data availability.
Example: NodesMinimum alarm notifies if any node has been unreachable for one day.
-
Indexing Issues: Detect slow or failing indexing, impacting search performance and data freshness.
Example: ThreadpoolWriteQueue and ClusterIndexWritesBlocked alarms notify when indexing requests are blocked or queued excessively.
-
Query Performance: Monitor query latency and throughput to ensure optimal search performance.
Example: ThreadpoolSearchQueueAverage and 5xxErrors alarms notify when query concurrency is high or query failures occur frequently.
-
Storage Capacity: alarm when storage capacity is approaching limits, preventing data loss and ensuring cluster stability.
Example: FreeStorageSpace alarm notifies when a node’s free storage space is critically low.
-
Cluster Health: Monitor the overall health status of the cluster.
Example: ClusterStatusRed: This alarm goes off when a crucial part of your data storage system is missing or not working, indicating a serious problem that needs immediate attention. ClusterStatusYellow: This alarm alarms you when a backup part of your data storage system is missing or not working, signaling a potential risk but not an emergency.
-
JVM Memory Pressure: Detect high JVM memory usage, which could lead to out-of-memory errors.
Example: JVMMemoryPressure and OldGenJVMMemoryPressure alarms notify when JVM memory pressure is critically high.
-
Snapshot Failures: Identify issues with automated snapshots, crucial for data backup and recovery.
Example: AutomatedSnapshotFailure alarm notifies if an automated snapshot fails.
-
Anomaly Detection and Plugins Health: Monitor the health of various plugins and anomaly detection features.
Example: ADPluginUnhealthy and SQLUnhealthy alarms notify if the anomaly detection or SQL plugins are not functioning correctly.
Implementing CloudWatch alarms with Terraform
To streamline the process of setting up alarms, we’ve prepared Terraform code that creates all recommended alarms as per AWS documentation. Here’s how to use it:
- Clone the repository:
git clone https://github.com/tecracer/opensearch.git - Navigate to the alarms directory:
cd opensearch/opensearch-alarms - Review and modify the
terraform.tfvarsfile to match your OpenSearch cluster setup - Run
terraform applyto create the alarms
Note: You don’t need to set up all alarms if you’re not using certain features (e.g., plugins, UltraWarm, or master nodes). Review the descriptions and comment out unnecessary alarms as needed.
For more details, see the GitHub repository.
Example alarm
resource "aws_cloudwatch_metric_alarm" "cluster_status_red" {
  alarm_name          = "ClusterStatusRed"
  comparison_operator = "GreaterThanOrEqualToThreshold"
  evaluation_periods  = "1"
  metric_name         = "ClusterStatus.red"
  namespace           = "AWS/ES"
  period              = "60"
  statistic           = "Maximum"
  threshold           = "1"
  alarm_description   = "Cluster status is red"
  alarm_actions       = [aws_sns_topic.alarms.arn]
  ok_actions          = [aws_sns_topic.alarms.arn]
  dimensions = {
    DomainName = var.domain_name
    ClientId   = data.aws_caller_identity.current.account_id
  }
}
This alarm triggers when the cluster status turns red, indicating that at least one primary shard and its replicas are not allocated to a node.
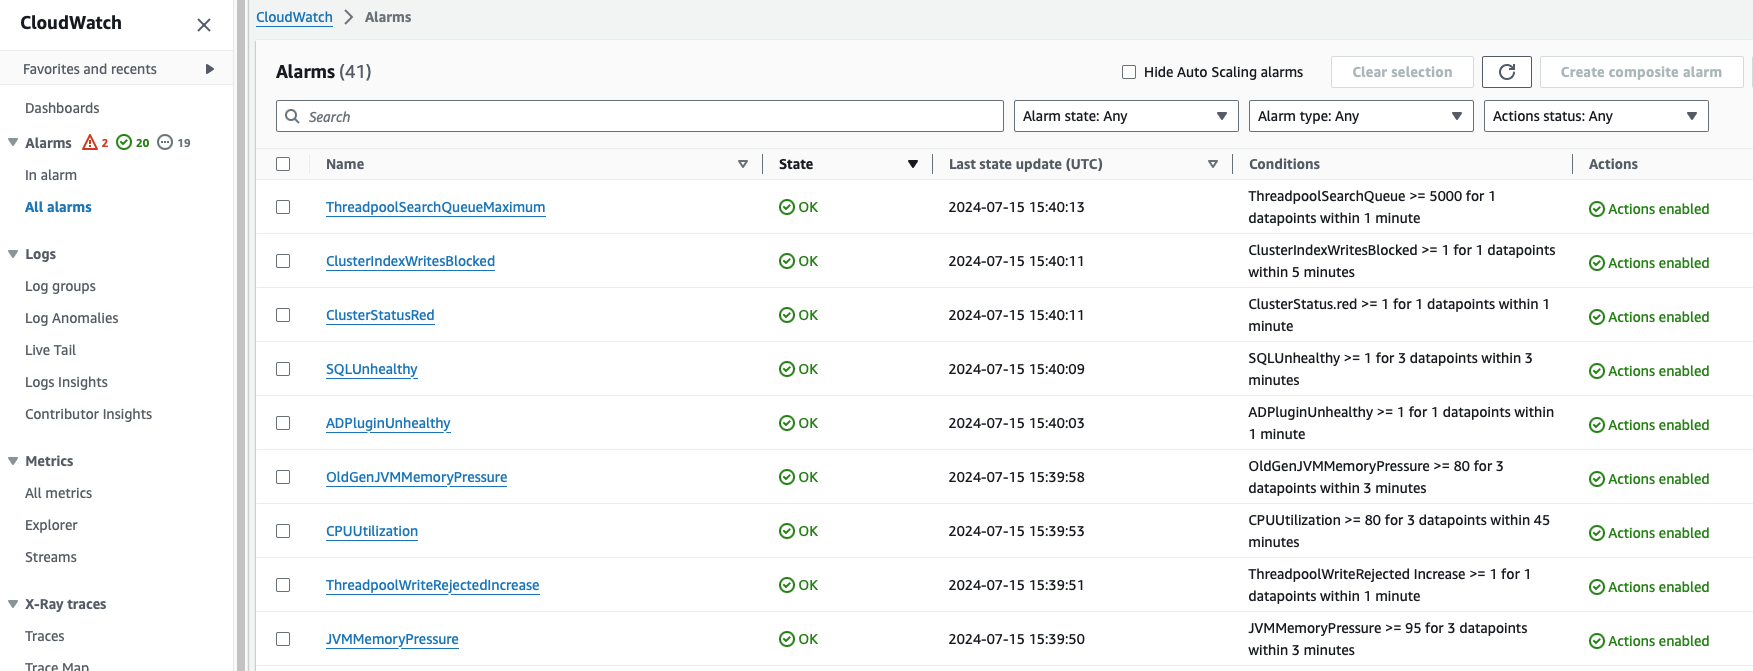
You can view the status of alarms in the CloudWatch console and receive the necessary notifications using the SNS topic.
Cost Considerations
Implementing these CloudWatch alarms incurs a small additional cost:
- Approximately $0.10 per month per metric
- Total cost for all 38 metrics: approximately $3.80 per month
This minimal investment provides substantial value in terms of improved monitoring and reduced downtime risk.
Conclusion
Effective monitoring of Amazon OpenSearch Service is essential for maintaining high performance, reliability, and user satisfaction. By leveraging CloudWatch metrics and alarms, you can gain deep insights into your cluster’s health and performance, enabling proactive issue resolution.
The provided Terraform code simplifies the process of setting up comprehensive monitoring, allowing you to focus on deriving value from your OpenSearch cluster rather than managing its underlying infrastructure.
Remember to regularly review and adjust your monitoring setup as your usage patterns and requirements evolve, ensuring that your Amazon OpenSearch Service continues to meet your needs.