Querying Local Health Check URLs
Do you run software that provides locally available health checks via a webserver only reachable via localhost?
In this blog post, I will show you an architecture that you can use to connect those local health checks to CloudWatch Logs and even receive alarms if things are not going to plan.
Challenge
Over the years, our company has implemented and operated a lot of different software solutions. This almost always includes a concept about checking the systems for imminent or slowly approaching problems. Availability of certain microservices, components of the software solution, or the status of some integrated OpenSearch servers.
While it is still common to simply check for open TCP/UDP ports, systems increasingly offer REST endpoints that output JSON with more details. If you are using standard monitoring solutions, you often have a solution for checking ports - but extracting information from REST endpoints is still lacking.
The following is an excerpt from a Chef server status page:
{
  "status": "pong",
  "upstreams": {
    "chef_opensearch": "pong",
    "chef_sql": "pong",
    "oc_chef_authz": "pong"
  },
  // ... more data ...
}
You can see that we have three sub-components that have their individual status checks. Only problem: this check is only available on http://localhost:8000/_status. And we probably do not want to reconfigure the system so we can check this externally.
Solution
If you followed my previous post about scheduling tasks on EventBridge instead of a local cron process, you might have an idea where we are going.

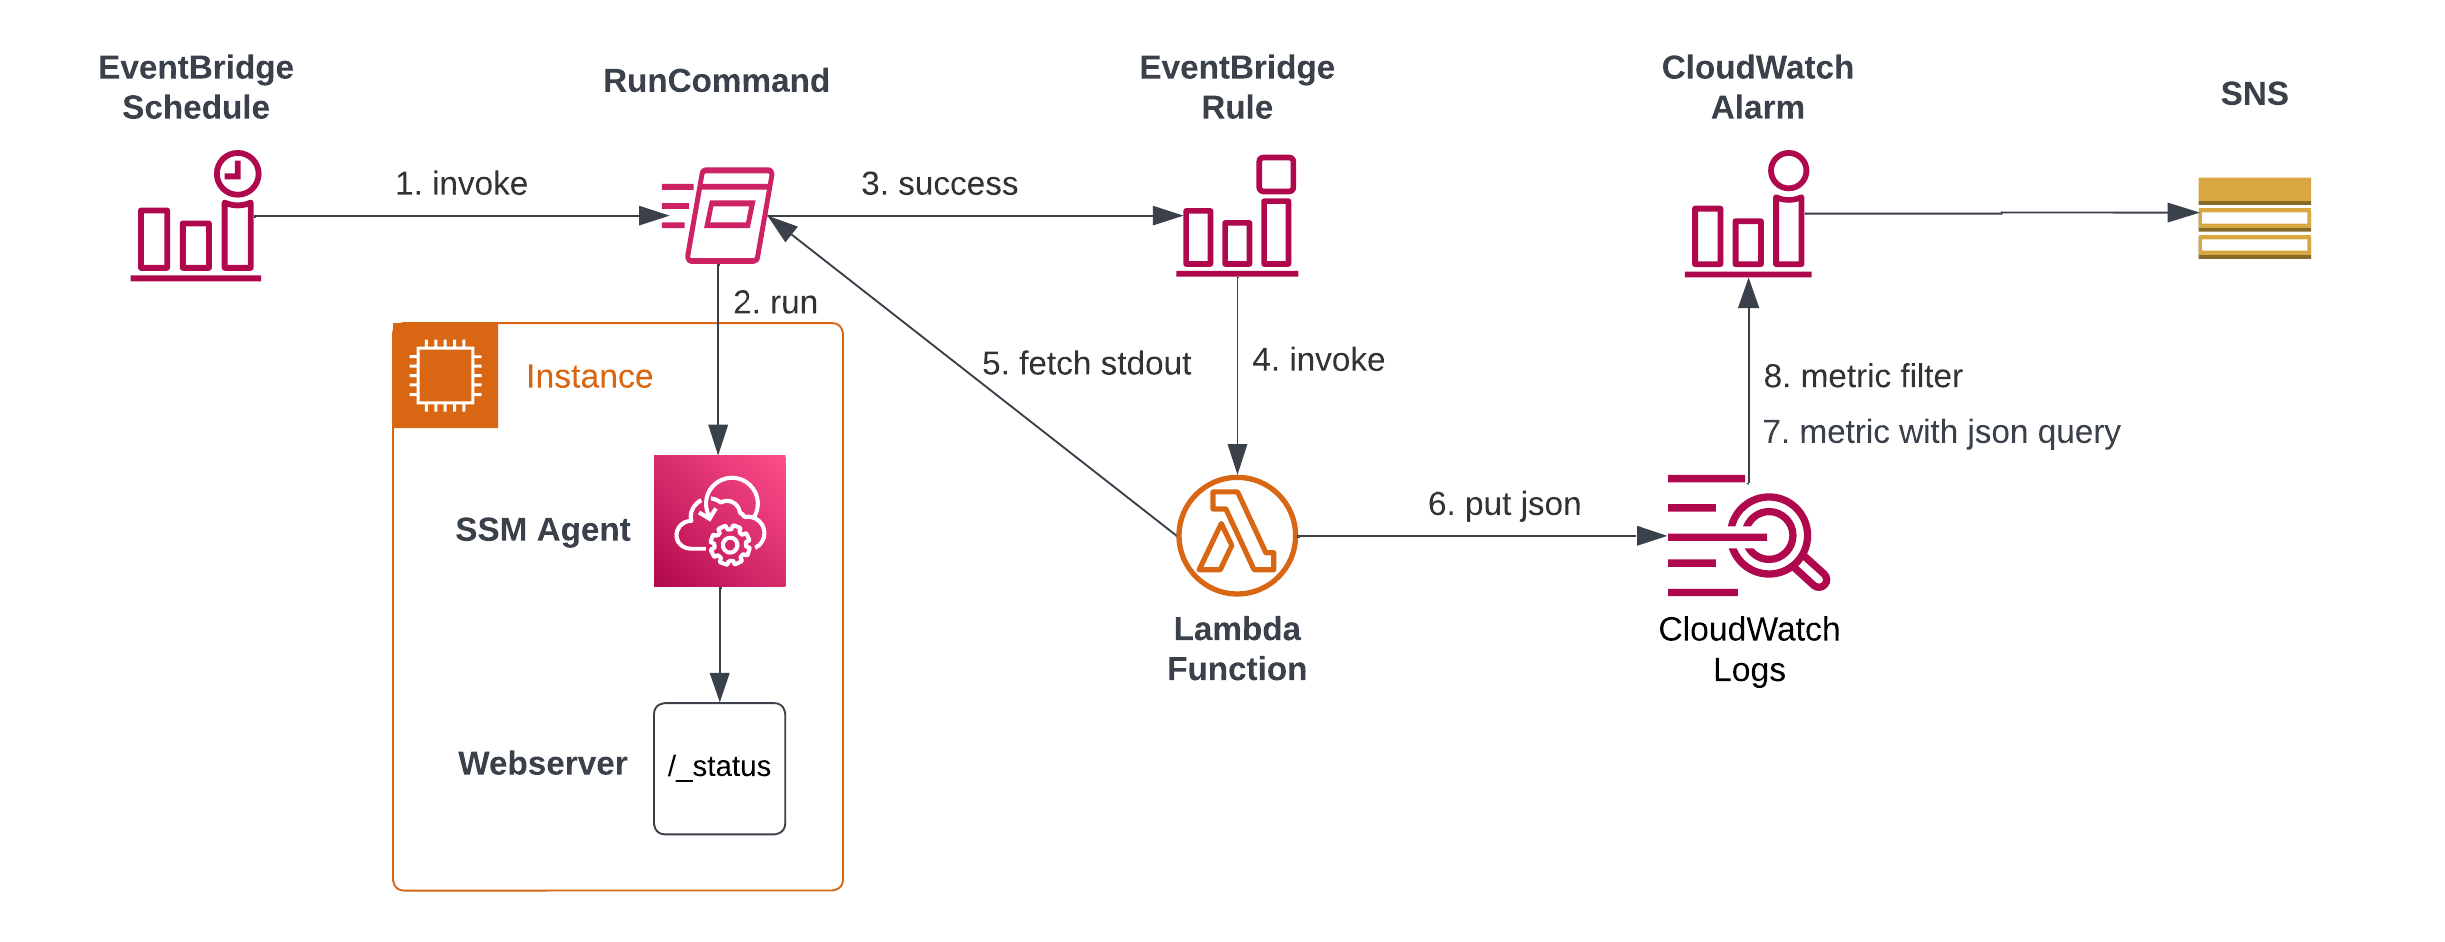
For our local health checks, we will expand the architecture slightly. Again, we will use EventBridge Schedules to periodically trigger a local curl (or wget or PowerShell equivalent) via SSM RunDocuments. We will then wait for successful executions of this command, get its output and put it into CloudWatch Logs.
My first thought was to directly get the data from the successful run and use an EventBridge Transformer to directly push it into CloudWatch. Sadly, the notifications that EventBridge receives do not include the standard output. On second thought, that makes sense as this part might be pretty big and AWS does not want to push big objects through its event system.
Consequently, we need a small Lambda function for this. It receives the Command ID and Instance ID from the SSM execution, retrieves the execution details and then uses CloudWatch Logs’ PutLogEvent interface for publishing.
As CloudWatch includes a JSON query syntax, we can also extract only the relevant fields from the status response and set up individual metrics. Success messages will be mapped to 1 and failures will be mapped to 0. It is important to define the metric filters such that missing data (e.g. a failed SSM execution) is handled like a failure as well.
In the end, individual CloudWatch Alarms can be defined on the metrics and then be used to notify via SNS or the paging/alerting system of your choice.
Terraform Module
The detailed setup has some minor complications, which I try to spare you from by publishing a Terraform module for your local health checks in Infrastructure-as-Code setups.
The following code would work for our example from Chef above:
module "healthchecks" {
  source  = "github.com/tecracer-theinen/terraform-aws-local-healthcheck"

  name         = "chefserver"
  instance_ids = ["i-123456789012"]
  local_url    = "http://localhost:8000/_status"

  cloudwatch_alarms = [
    ["Opensearch", "{ $.upstreams.chef_opensearch = \"pong\" }"],
    ["SQL", "{ $.upstreams.chef_sql = \"pong\" }"],
    ["Authz", "{ $.upstreams.oc_chef_authz = \"pong\" }"]
  ]
}
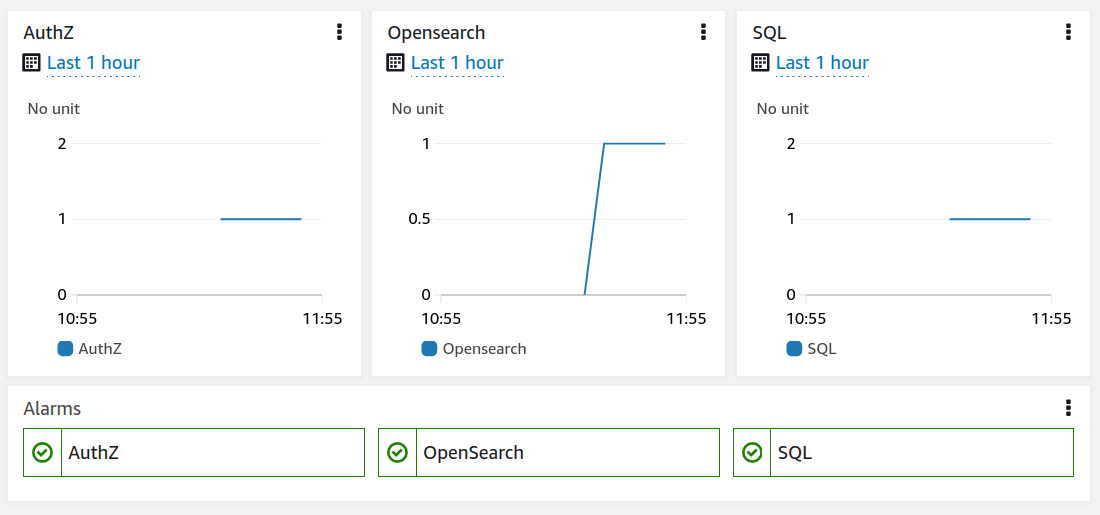
As a result, you will get one scheduled health check to be run every 5 minutes (the default) and the corresponding three metrics and alarms.

Summary
I hope the ability to schedule health checks from local URLs helps in your projects. There is nothing against using the same technique to query subnet-scoped endpoints (like Amazon FSx for NetApp ONTAP) as well, though. In those cases you will have to modify the code I provided to not stream into a CloudWatch Log Stream for the instance, but some other identifier.
Feel free to report issues or feature requests on the GitHub repository.
