How boto3 impacts the cold start times of your Lambda functions
This content is more than 4 years old and the cloud moves fast so some information may be slightly out of date.
AWS Lambda is a really cool service that I use it extensively in the serverless architectures I design and build. My implementation language of choice in these cases is usually Python - not only because I’m most familiar with it, but also because it integrates well in the Lambda ecosystem. The startup times and resource requirements compared to Lambda Functions written in something like Java are really low and using the Lambda code editor to quickly troubleshoot issues in your code makes for quick iterations (don’t do that in production though).
Most of my Lambda functions make some call to at least another AWS service using the AWS SDK for Python: boto3.
I knew that boto3 is not the most lightweight library, but I noticed some time ago, that it takes a bit of time to initialize the first boto3 object.
After seeing a question on stackoverflow, I decided to take a closer look.
In this post I’ll first show you the architecture I used to measure how boto3 initializations impact the time your Lambda function takes before it can perform any meaningful work and how that behaves in relation to the available performance resources.
Then we’ll discuss the measurements and my attempts to explain why we see this behavior.
In the end I’m going to tell you some of the conclusions I make based on this.
The setup
How do you measure how long it takes to instantiate a boto3 client or resource?
The general idea is pretty simple, here’s a code sample:
from datetime import datetime
import boto3

start_time = datetime.now() # Start the clock
boto3.client("dynamodb")
end_time = datetime.now() # Stop the clock

time_it_took = (end_time - start_time).total_seconds()

print(f"Initialization of a boto3.client took {time_it_took} seconds.")
If you instantiate other boto3.client or boto3.resource objects after that first one, you’ll notice that this is a lot quicker.
That’s because the library does some caching internally, which is a good thing.
This also means we need to make sure we measure the cold start times, because these are going to be our worst case scenario.
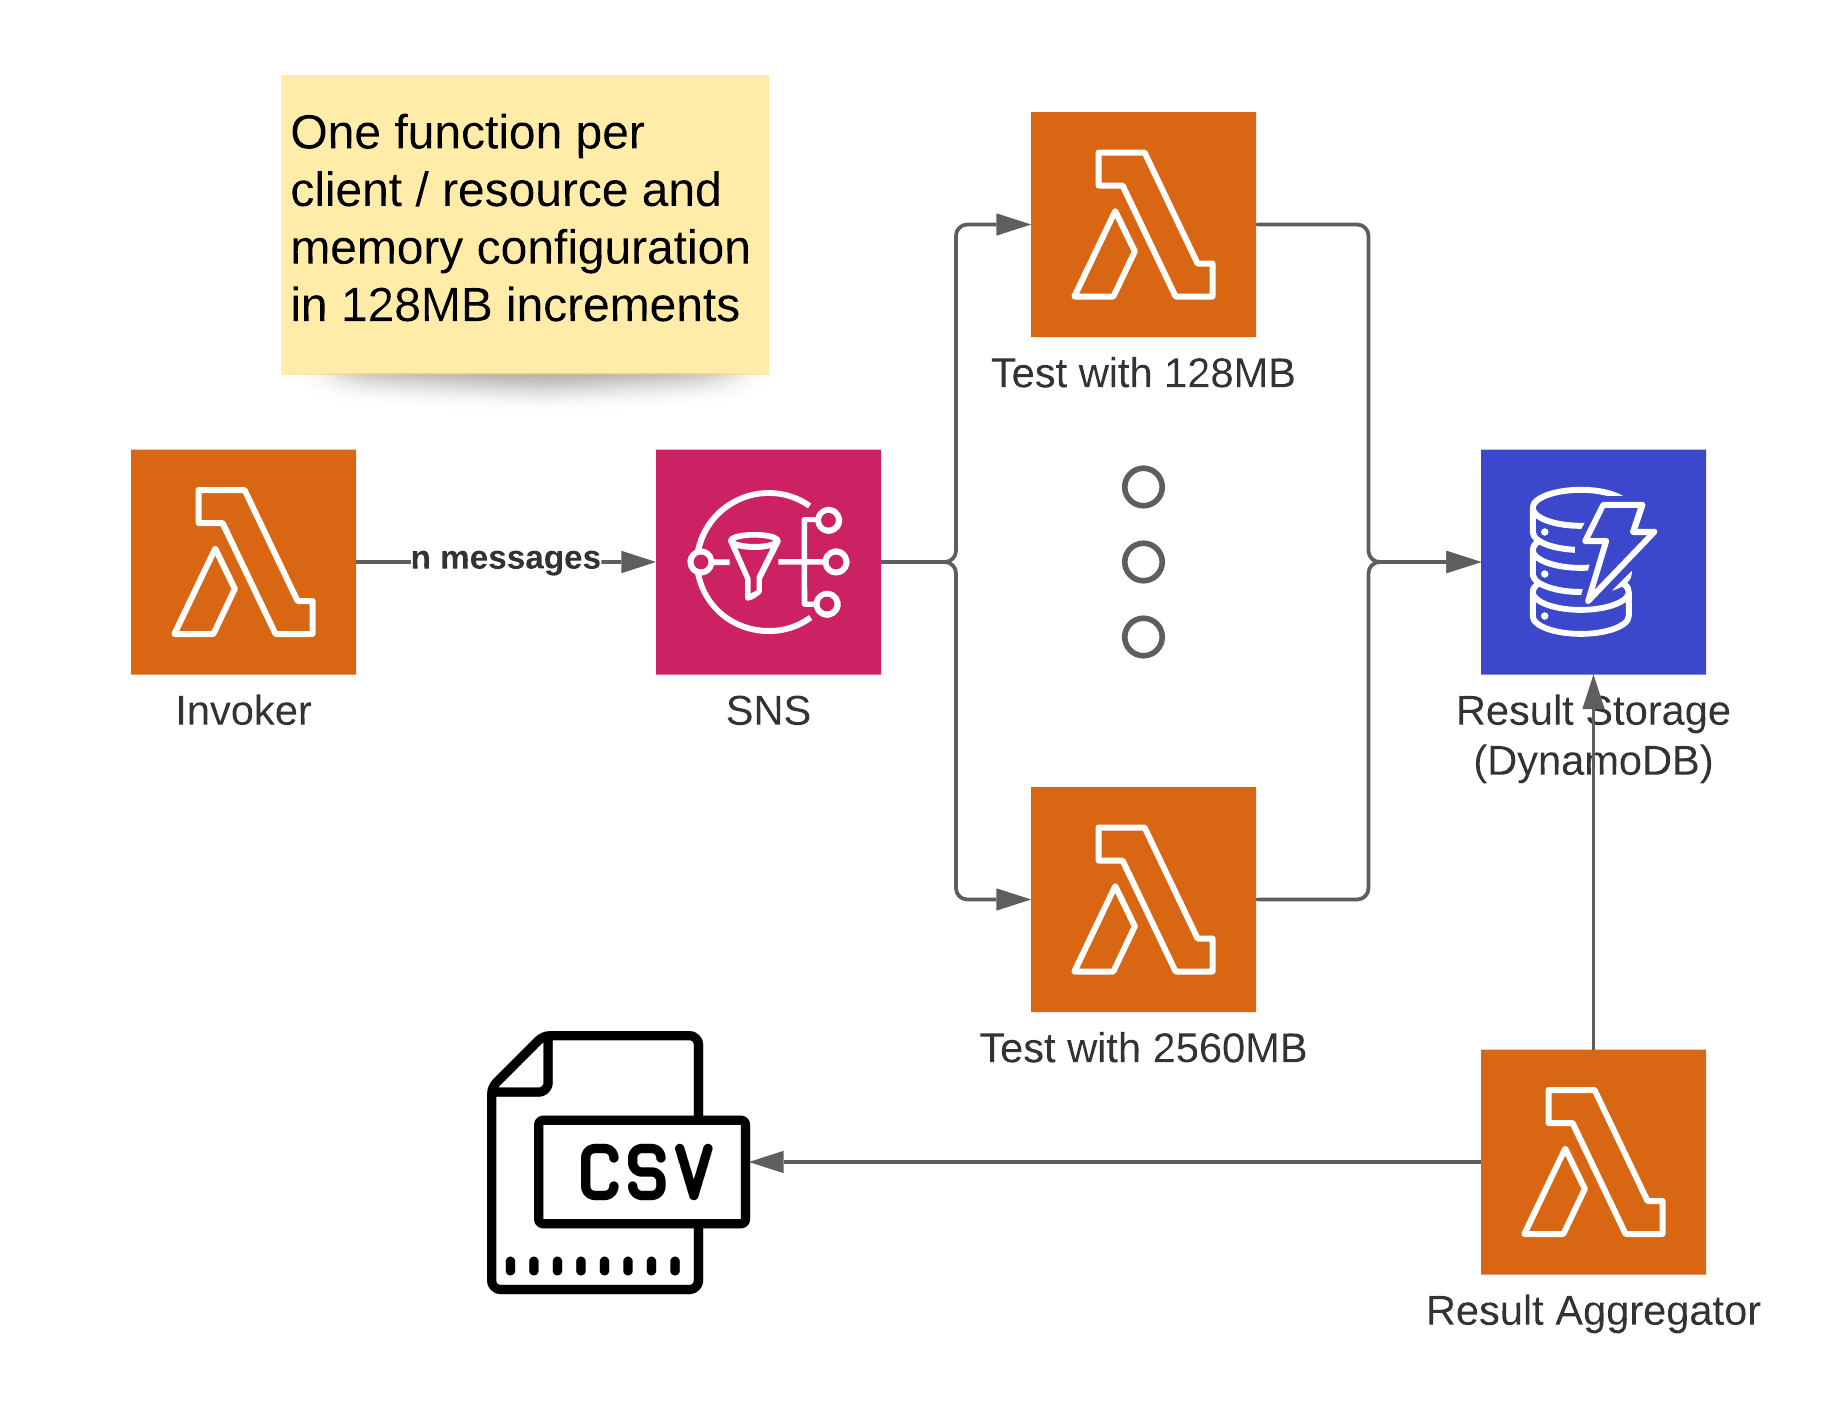
Earlier experiments had led me to believe, that CPU and general I/O performance have a significant impact on this first instantiation. I decided to systematically test this by measuring the execution times with different Lambda functions. Since properties like CPU or network throughput in Lambda scale based on the memory available to the function, I built the following setup.
I created a CDK app, that builds multiple Lambda functions with the same code but different memory configurations for me.
For my tests I set 128 MB as the lower boundary and 2560 MB as the upper one and created Lambda functions in increments of 128 MB memory between these two boundaries.
That resulted in 20 experiments.
I doubled that to 40, because I wanted to test both boto3.client as the lower level implementation and boto3.resource as the higher level abstraction.
To invoke these functions I’ve used an SNS topic with another Lambda in front of it, which sends - in my case - 100 messages to the topic. Each experiment-Lambda records its result in a DynamoDB table. There’s also a 42nd Lambda (for obvious reasons), which aggregates the results in the table into a CSV format.

The CDK app is available on Github, so you can try this for yourself and take a closer look at the code. Setup instructions are part of the repo. To ensure I’d only measure actual cold starts, I had to use some tricks. First I had to detect if the current invocation is a warm-start and if that’s the case, raise an exception. In order to achieve that I used an implementation like this.
IS_COLD_START = True

def handler(event, context):
    global IS_COLD_START

    if not IS_COLD_START:
        raise RuntimeError("Warm Start!")

    # Other code

    IS_COLD_START = False
This stops me from recording the warm-start times, because global variable “survive” through multiple invocations.
Now I’ve got the problem, that a lot of my Lambda calls are going to fail, because it’s trying to re-use existing execution contexts.
To avoid I implemented an easy way to get rid of these warm execution contexts.
I update the Lambda function configuration at the end of a sucessful run.
In my case I just add an environment variable called ELEMENT_OF_SURPRISE with a random value.
If you’re curious about the implementation, check out the code on Github.
The result aggregation is not very interesting, I basically collect the measurements from the table and calculate an average over all calls, per method, per memory configuration, which is then formatted as CSV for ease of use in Excel. Let’s talk about these results next.
Results
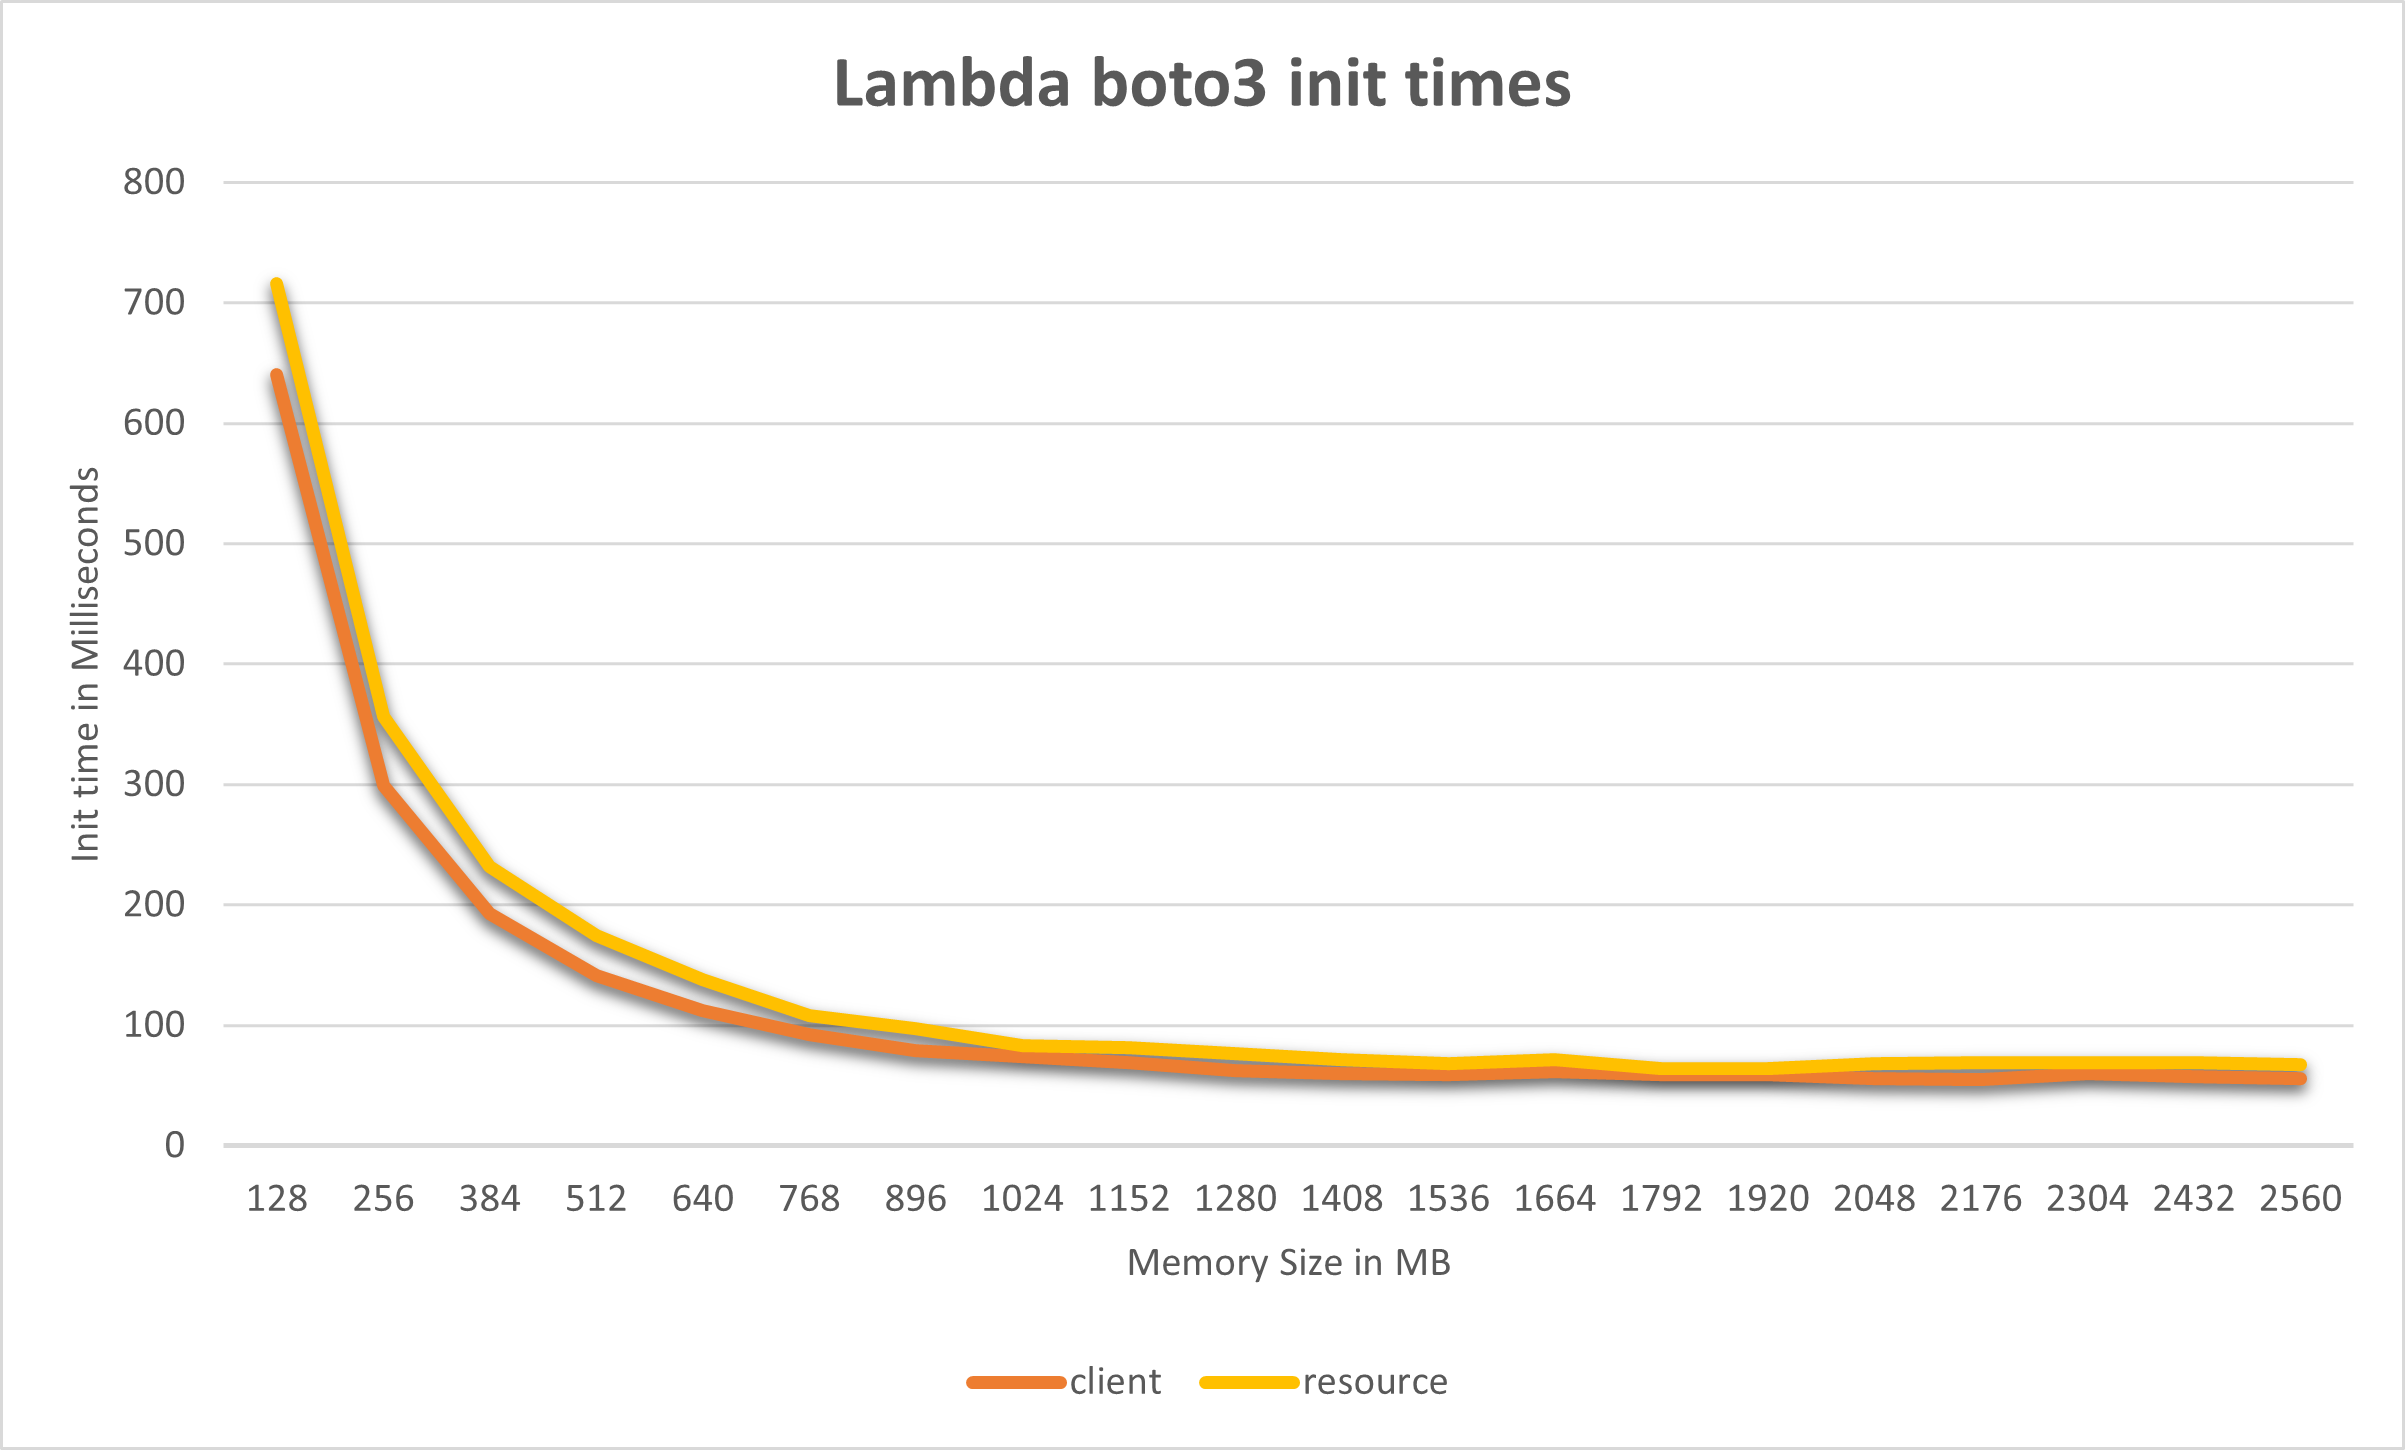
Based on the more than 100 measurements per configuration I described above, I’ve compiled this chart to show the results.
The y-axis indicates how long this initial instantiation of either the client or resource took.
On the x-axis you can see the amount of memory that has been allocated to the Lambda function.
Each measurement is the average of at least 100 individual measurements.

As you can see the amount it takes dramatically decreases as soon as we increase the performance characteristics of the function. In fact we can see by looking at the table below, that the initial instantiation of both the client and resource take more than 10 times as long for a Lambda with 128 MB RAM when compared to one with those that have at least 1408 MB RAM, which seems roughly proportional.
A closer look at the data reveals, that it is in fact not proportional, the initial gains are vastly greater than the later ones. We observe diminishing returns and beyond the threshold of about 1408 MB it doesn’t really matter anymore if you increase the memory. That’s probably around the threshold where a second vCPU core is added to the function. (I have left out the later results, because they’re essentially the same, you can view the whole result set on GitHub.)
| Memory Size (MB) | client init (ms) | resource init (ms) |
|---|---|---|
| 128 | 640 | 716 |
| 256 | 299 | 356 |
| 384 | 193 | 232 |
| 512 | 141 | 174 |
| 640 | 112 | 138 |
| 768 | 92 | 108 |
| 896 | 79 | 97 |
| 1024 | 74 | 83 |
| 1152 | 69 | 81 |
| 1280 | 62 | 76 |
| 1408 | 60 | 71 |
| 1536 | 59 | 68 |
| 1664 | 61 | 71 |
| … | … | … |
Let’s now consider what we can learn from that.
Conclusions
- For “user-facing” functions, such as Lambdas behind an API Gateway or ALB that need to talk to another AWS service through
boto3, the minimum memory amount that I’d recommend is between 512 and 768 MB. Consider that after initializingboto3no actual work in terms of service communication has happened. That’s time that will be added on-top. - The - in my opinion - very cool implementation of
boto3, which essentially builds the whole API from a couple of JSON files, has a severe performance penalty on first initialization. - Doubling the memory in the lower areas of the MB-spectrum results in double the performance, but there are diminishing returns (note: this is not necessarily true for all workloads), this is most likely due to our particular workload not scaling across multiple CPU cores.
I hope you liked this investigation into how boto3 initializations impact the time your Lambda function takes before it can perform meaningful work.
If you want to get in touch, I’m available on the social media channels listed in my bio below.
– Maurice
